DAND6 JSDoc
All components of the applications that draw a chart make use of the AppChart class which is the only one that actually issues d3.js code. The AppChart gets one container object and places an inline SVG into it which it then further subdivides into various layers and sub-layers. Each layer is stored in an internal variable of the AppChart object and thusly easily accessible when drawing/updating data.
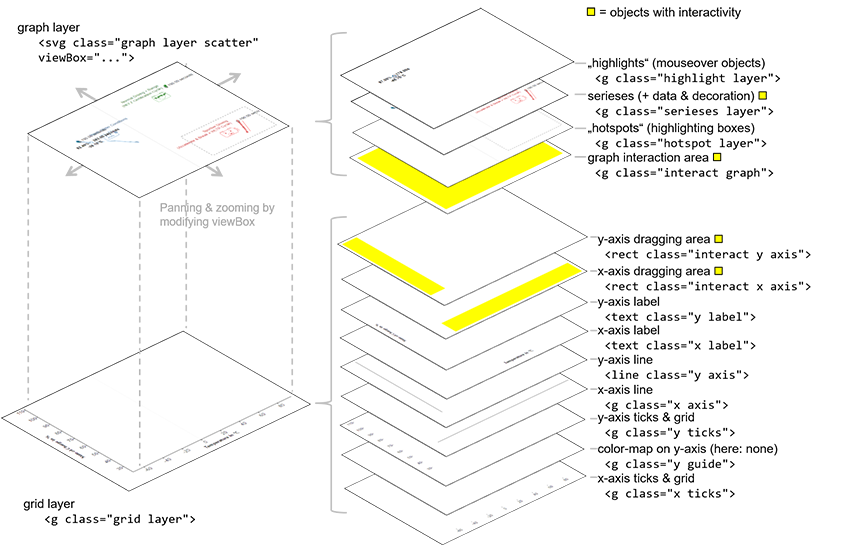
When designing this layer structure, the following problems had to be solved:
- Zooming and panning worked best when encapsulating everything "movable" in one big sub-SVG, the
graph layer. This SVG can then get aviewBoxattached allows to clip a window of the graph that is actually to be shown. - In order to add interactivity, certain transparent rectangles, in the image shown in yellow, had to be added (for example to be able to catch drag-events on anotherwise empty graph canvas).
- Attaching classes to the SVG elements allowed for easy CSS-manipulation via the CSS file
css/_AppChart.sass. - Sometimes those classes are added and removed dynamically, e.g., if certain elements are highlighted by mouseover (e.g. class
highlighted).
The following picture shows the resulting structure of those layers: