 DAND6 JSDoc
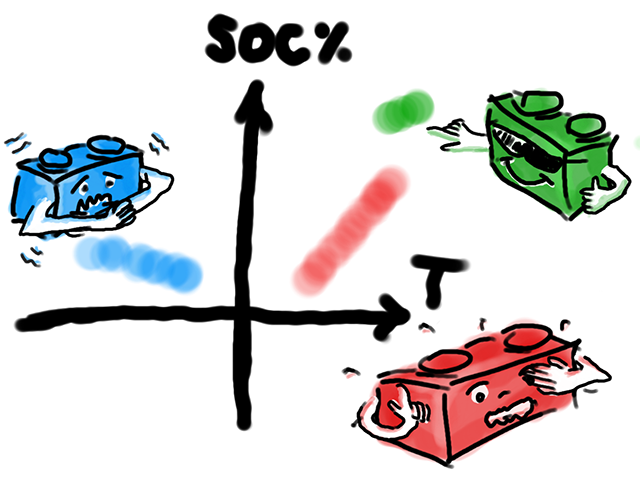
Welcome
This documentation is for the curious mind who wants to understand and potentially re-use the code of this visualization. Feel free to browse the modules and classes of the project.
How to start
Before diving into the API Doc and into the code, there are a few conceptual documents listed under "Tutorials" that I recommend reading to get a general understanding about the source code:
- File & Directory Structure contains a general "what is where" of the repository.
- Terminology describes a number of clearly defined concepts you see on the screen of the application.
- JSON Class Structure of Data Files contains the file structure of the visualized data and may be especially useful for readers that want to swap out the dataset with other data.
- Components of the Application describes the components you see on the web application. This application uses AngularJS, a framework that lets us define "extensions" to HTML and attach custom behaviours to those new elements. For drawing the charts, dropdowns, battery schematics etc. this is heavily used.
- Interaction of the Components explains how the components described above exchange data so they all update simultaneously and thusly provide a consistent user experience.
- Layers in the AppChart D3.js Graph goes into deeper detail about how our chart implementation's internal SVG layering is designed so that all small things of the chart, like axes, labels, data points etc. all fall into place at the right position.
Frameworks Used & Copyrights
- Bootstrap (MIT License)
- Bootstrap Sass
- jQuery (MIT License)
- AngularJS (MIT License)
- D3.js (BSD License)
- Requirejs (New BSD or MIT License)
- Underscore (License)
- JSDoc (Apache License 2.0)
- JSDoc Bootstrap / Docstrap (License)
- ElementQueries, ResizeSensor
For development: