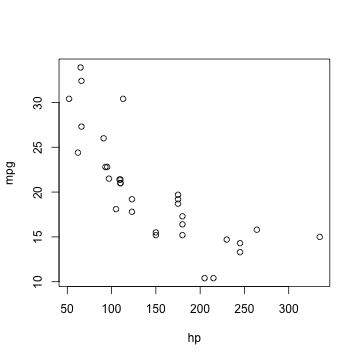
library(ggplot2) plot(mpg ~ hp, mtcars)
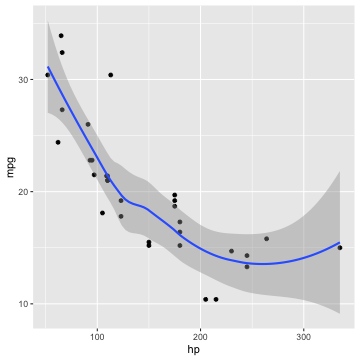
ggplot(mtcars, aes(hp, mpg)) + geom_smooth()
library(knitr)
opts_chunk$set(fig.width = 5, fig.height = 5)
This is a minimal example which shows knitr working with HTML pages. See here for the output and here for the source.
Boring stuff as usual:
## a simple calculator
1 + 1
## [1] 2
## boring random numbers
set.seed(123)
rnorm(5)
## [1] -0.56048 -0.23018 1.55871 0.07051 0.12929
We can also produce plots (centered by the
option fig.align='center'):
library(ggplot2)
plot(mpg ~ hp, mtcars)
ggplot(mtcars, aes(hp, mpg)) + geom_smooth()
Errors, messages and warnings can be put into div's
with different classes:
sqrt(-1) # warning
## Warning in sqrt(-1): NaNs produced
## [1] NaN
message("knitr says hello to HTML!")
1 + "a" # mission impossible
## Error in `1 + "a"`:
## ! non-numeric argument to binary operator
In the end, let's show off a 3D plot from the rgl package.
library(rgl)
knit_hooks$set(rgl = hook_rgl)  # set up the hook first
plot3d(data.frame(x = rnorm(100), y = rnorm(100), z = rnorm(100)), col = rainbow(100))
par3d(zoom = 0.8)

Well, everything seems to be working. Let's ask R what is the
value of π? Of course it is 3.1416.