jsxGraph Demonstration
JSXGraph is a cross-browser library for interactive geometry, function plotting, charting, and data visualization in a web browser. Developed at the University of Bayreuth, Germany and open source released under the MIT license.
- Learnng how to use an external library.
- Reading documentation and implemeting functionality.
- Right-click to view source.
Sample Graphs
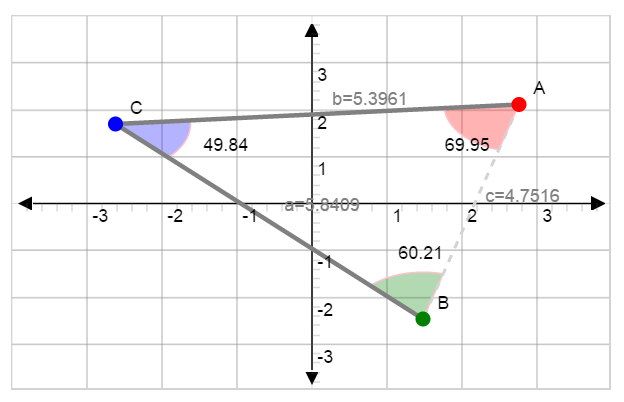
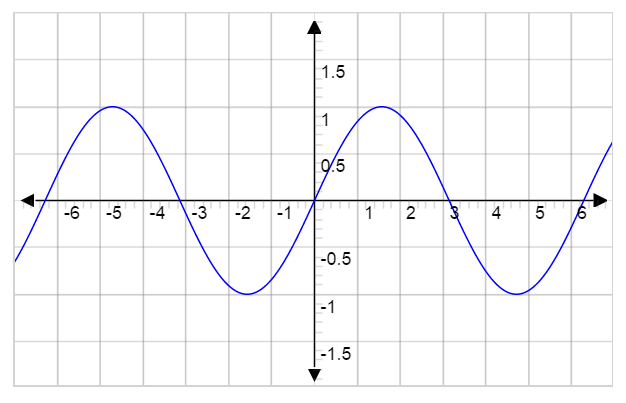
Graphs can be hard coded and the graph options are numerous. For example we can zoom and pan.
- Configuring jsxGraphs
- Incremental programming and testing.
- Right-click to view source.
General Graphing App
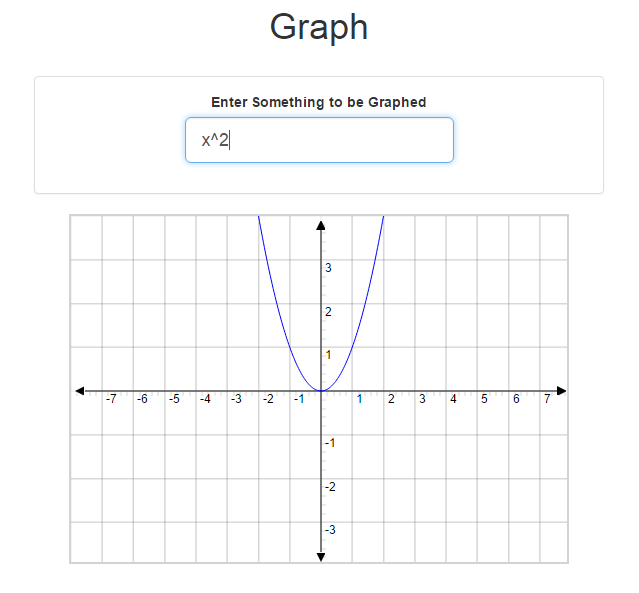
Type in a function, click the button, and see the graph. COMING SOON
- Dynamic interaction
- Bootstrap for the buttons and interface.
- Dynamic MathJax for real-time math rendering. Right-click to view source.


