interface version 1
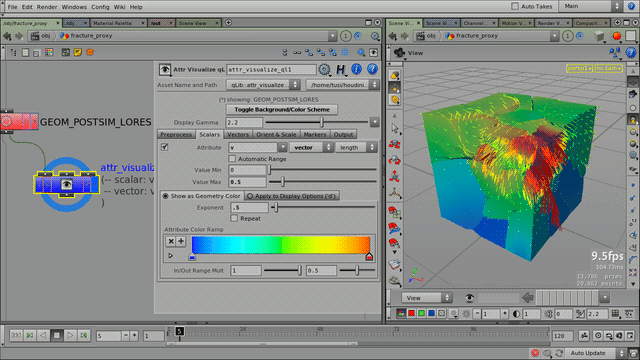
Various visualization types for geometry attributes.
This node can perform various attribute visualizations:
Display scalar geometry attribute values using a color map
Show vector attributes (as lines; multiple vector attributes can be displayed)
Show pscale-type attribute values (by copying appropriately-scaled geometry to each point)
Combinations are also supported, e.g. you can display velocity vectors and have them colored
according to their length, etc.
—
Tip
This node is very useful as “visual checkpoint” when constructing complex effects involving
more attributes. It’s a good working habit to mark important points of the node tree with visualizer nodes.
Note
By default the primitive-count limit is enabled (to avoid hanging Houdini when connecting this node
to heavy geometry). This setting may also delete all “unused” points, so you might see some unexpected
results if applied to point clouds.
Use the Preprocessing/Decimation -> Presets menu to quickly switch between the most frequently
used settings. For visualizing point clouds, choose Point Cloud Mode.
Parameters
| Input
| Select which geometry input to visualize. Two (2) input slots are available.
Workflow-wise this allows to connect a “before” and an “after” state, and quickly switch between
them for comparison.
|
| Preprocess
| | Decimation & Safeguards
| Ways of reducing the amount of geometry to visualize.
| Scrambled Order
| Randomize point and/or primitive order.
Can be useful to break emerging geometric patterns from geometry reduction (below).
| | Keep Every Nth
| Keep only a single item for each N points or primitives.
| | Prim. # Limit
| Keep only the specified amount of primitives before doing any visualization.
This is a safeguard measure to avoid accidents like hanging on a very
large geometry.
Note: This function is intentionally enabled by default
(to protect the visualizer from getting a too heavy “geometry hit”.)
|
| | Attribute Promotion
| Parameters in this tab allows visualizing other attribute types than per-point,
by modifying the geometry itself and/or convert attribute(s) to per-point type.
| Unique Points
| This splits all shared geometry points, so there will be the same number of
points as vertices – allowing per-vertex attributes to be visualized as
per-point.
Tip
The Unique Points / Primitive Scale combination can also be used
to visualize tetrahedrons.
| | Primitive Scale
| Applied to all primitives after the Unique Points operation. Especially with
previously shared points, this can make individual points visually more
distinct.
| | Promote Attribute(s) to Per-Point
| After the preprocessing above, all other attribute types (ie. per-vertex,
per-primitive, etc.) can safely be converted to per-point type for
visualization. A list of multiple attribute names is supported.
|
|
|
| Scalars
| Visualization of floating-point values by mapping the values to a color ramp
and apply the colors to the geometry accordingly.
Note
Other visualizations inherit these colors.
| Attribute Name, Type, Component
| Name of the attribute to visualize (a single attribute name only), as well as
the attribute type (integer, float, vector) and component (X, Y, Z, length, luminance).
| | Automatic Range
| If enabled, the attribute value range (min/max value settings) will be determined automatically.
(The Exponent setting still applies.)
| | Value Min, Max
| The value range the color ramp will be mapped to.
| | Show as Geometry Color
| This mode uses the per-point color attribute (Cd) to display the visualization.
| Repeat
| The ramp will be “repeated” for values outside the specified range
(so values outside the visualization range can still be distinguished).
| | Attribute Color Ramp
| The ramp representing the range of values.
(If disabled, a greyscale gradient is used.)
| | Gain
| A global color multiplier on the ramp.
(It can be used to create red/green/blue component ramps
to use with additive Composite.)
| | In/Out Range Mult
| Intensity multiplier (brightness) both for values inside and outside the
visualization range. By default outside-range colors have an 50% brightness (0.5).
| | Composite
| How to mix the current colors with an already existing color
(useful for applying layered visualizations, e.g. R/G/B composites).
The modes are Replace, Add, Multiply.
| | Display Gamma
| Color-correction for non-linear viewport settings. Set this gamma value to
the same you set up in your viewport (2.2 for sRGB).
|
| | Apply to Display Options
| This mode uses the Houdini’s built-in attribute-to-color visualization options
(Display Options D -> Geometry -> Override Color Attribute).
See Display Options / Attributes for more details.
| Color Map
| Type of color ramp to use for visualizing the attribute.
| | Apply to Override Color Attribute
| Apply the visualization settings (all viewports).
| | Disable Override Color
| Disable the visualization settings (all viewports).
|
|
|
| Vectors
| Vector visualization (drawn as line segments from geometry points).
| Attribute Name
| Name of the attribute(s) to visualize (multiple attributes can be specified).
| | Scale
| An uniform scaling factor on the vectors display.
| | Unit Length
| The equivalent of unit type. This is relevant only with velocity-type vectors
where the unit is distance-per-second. (If visualizing velocity, select “Velocity”
from the preset menu.)
Note that this applies to all vectors being visualized.
|
|
| Orient & Scale
| Orient/scale-type visualization (implemented using a Copy SOP). A geometric object is
copied to each point of the input geometry.
The size of each copy will be affected by the pscale attribute;
Orientation will be affected by existing orientation (orient), velocity (v),
normal (N) and up vector (up) attributes.
|
| Markers
| Here the specified attributes can be automatically set up as markers for viewport display
(Display Options->Markers – press D in the viewport).
| Auto-Update on Display
| If enabled, all markers will be generated automatically when displaying this node,
and removed when another node is displayed.
Use this feature with the Display in views parameter (see below).
| | point, primitive, vertex
| Viewport display markers will be generated for all the attributes listed in these fields.
(An enabled and empty field results in using all attributes).
| | As Numeric
| The attributes listed here will always be displayed in numeric (textual) format, regardless
of their type (useful for numeric display of vector attributes).
| | As Velocity
| The attributes listed here will be considered as velocity-type attributes (they use a different
scale setting).
| | Vector Scale
| The scale display setting for regular vector attributes.
| | Velocity Scale
| The scale display setting for velocity-type vector attributes (see above.)
| | Display in views
| All attributes listed here will have their display flag enabled for their markers
(all viewports).
| | Create/Update Markers
| Press this button to build or update the marker list in the viewports' Display Options.
| | Clear Markers
| Pressing this button will delete all automatically created markers.
User-defined “regular” markers will not be affected.
| | Clear All Markers...
| This button will delete all markers from the viewports' Display Options.
|
|
| Output
| Settings on how to output visualization results.
| Display Mode
| The way the geometry will be output (displayed).
Its main purpose is to allow displaying geometry points as particles, so
the points can be visualized without resorting manually toggling viewport
point displays.
| | Use Constant Material
| The geometry will have a constant-shaded viewport material assigned.
(so it will ignore scene lighing).
This allows easier inspection of any colors or texture on the geometry.
| | Point (Particle) Size
| A shortcut to the viewport Display Options->Geometry->Point Size slider.
Note
Limitation: this slider is not in sync with any other Houdini UI elements
for point size. (Also, it has a “write only” kind of behaviour – you
might need to “nudge” the slider a bit to update.)
|
|
Release Notes
interface version 1 —
| 2014-10-06
| |
| 2014-09-25
| |
| 2014-09-24
| New feature: “Auto-Update on Display” (Markers tab). This automatically applies the marker
setup when the node is displayed (and removes it if the display is switched to another node).
|
| 2014-09-21
| “Markers/Display in views” parameter now works again (it used H11 viewport flags, but it’s now updated)
Scalar value min/max parameters now have the same slider range
|
| 2014-09-15
| |
| 2014-07-19
| |
| 2014-06-07
| |
| 2014-04-05
| |
| 2014-02-07
| |
| 2014-02-04
| Changed default decimation values (raised prim limit; prim limit count is now accurate)
Added geometry component scrambling (for breaking patterns in Keep Every Nth component mode)
Attribute selector enhancements –
Now have detailed attrib menu builders (soon-to-be-universal)
Fixed several menu bugs (incorrect filtering of string attribs; typos)
Attributes are now listed from the proper (active) geometry input
Attribute names can now be changed even if the related visualization is off
(to allow working faster with heavy geometry)
Help card: added example screenshot
|
| 2013-12-31
| |
| 2013-07-31
| |
| 2013-06-01
| |
| 2013-05-19
| UI improvements:
|
| 2013-04-19
| |
| 2013-02-11
| Added automatic range detection to scalar-to-color visualizer.
Vector attribute popup menu now works in “replace” mode (although it supports multiple attributes,
users most often want to visualize a single one.)
|
| 2013-01-15
| Added attribute list that has their display enabled when building markers for them (first prototype).
|
| 2013-01-13
| Added experimental Output->Point Size slider to quickly adjust viewport point sizes.
|
| 2012-11-29
| New functionality: automatic attribute marker generation for viewport display options.
|
| 2012-11-08
| |
| 2012-10-24
| |
older versions —
| 0.0.6
| Support for multiple inputs with an input selector (allows connecting and switching between 'before'/'after' states).
|
| 0.0.5
| Floats & Colors section improvements:
Added exponent (gamma) to value mapper
Added Repeat toggle
Added intensity multipliers for within and outside the value range
The length component is now the default for vector attributes
|
| 0.0.4
| |
| 0.0.3
| |
| 0.0.2
| Functionality additions:
|
| 0.0.1
| First version.
|