interface version 1
Draws graphs for the RGB values of the specified image scanline.
The operator looks at a single horizontal scan line of an image and plots the RGB values of a pixel for each X location. The resulting curves are drawn on the original image (overlay).
Tip
It is useful for graphically see how color-corrections affect an image.
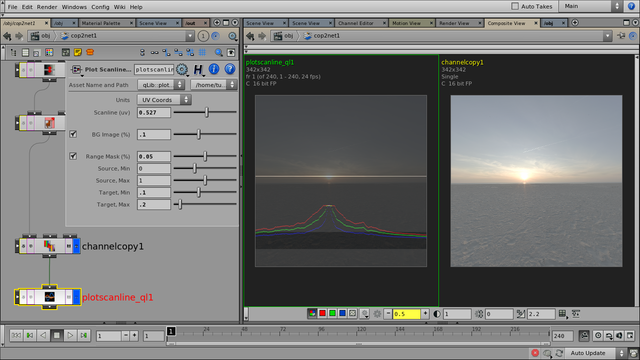
Plotting a scanline from a sky environment map (right: original image, left: plotted curves). The white line indicates the plotted scanline; the darker band at the bottom indicates the [0..1] range (Range Mask).
(The curves indicate overshoot-bright values at the Sun's region -- as it is a HDRI image).
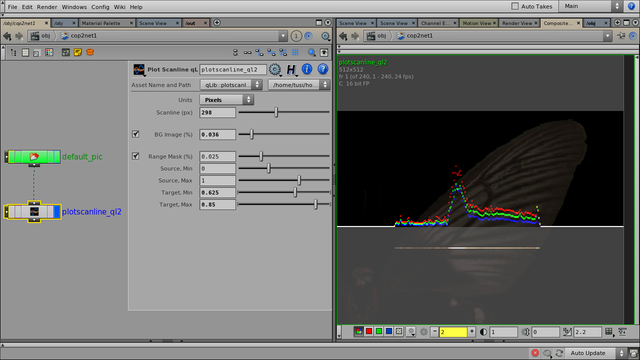
Plotting a butterfly wing. The white line on the wing indicates the scanline, with the corresponding RGB graphs displayed above. (The Target Min/Max values are used to position the graph vertically on the image.)
Note
This operator is the reimplementation of the classic PlotScanline node (from Nothing Real’s Shake compositing application – it was one of the most innovative compositing programs ever existed.)
Parameters
| Units | Pixel or UV units to use for scanline position. |
| Scanline (uv/pix) | Position of the scan line to be plotted (vertical). |
| BG Image (%) | The amount (percentage) of the original image to be faded in behind the graph display. |
| Range Mask (%) | If enabled, the [0..1] brightness range will be visually indicated on the image (see main image.) |
| Source/Target Min, Max | Brightness remapping for the curves' display. The source brightness range is remapped to fit into the target range. The target values can be considered as vertical placement for the plotted curves. Tip Try a target min/max of |
To Do
Alpha channel plotting should work (right now for some reason it doesn't, although it is connected)
Release Notes
interface version 1 —
| 2014-08-23 |
|