
Piękniej!
10 trików w ggplot2
Piotr Sobczyk
szychtawdanych.pl
Dlaczego warto ,,dopieszczać" wykresy?
- Wizualizujemy, żeby wywrzeć wpływ
- Tworzymy rzeczy piękne
- Zmiana danych nie oznacza pracy od zera
Od kopciuszka do trochę mniej kopciuszka
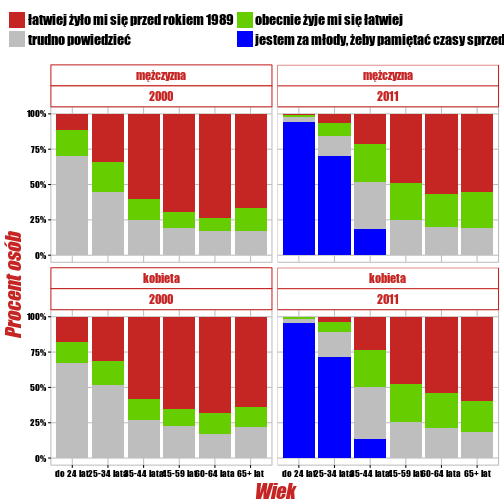
Od kopciuszka do trochę mniej kopciuszka
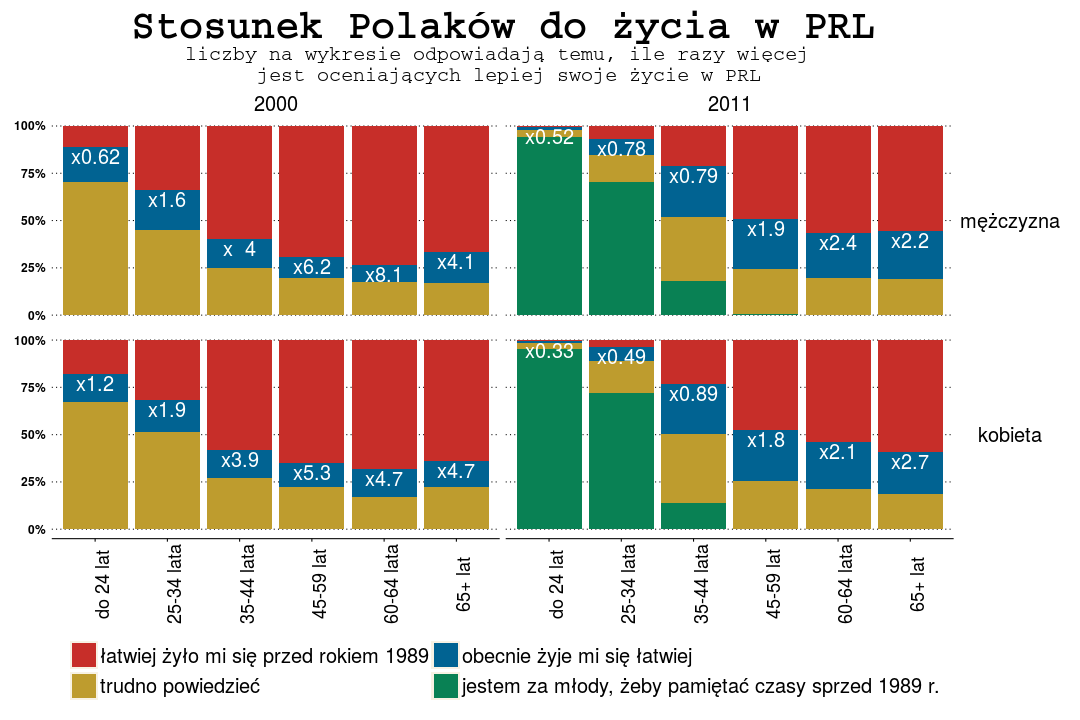
Od kopciuszka do trochę mniej kopciuszka
Zamiast wybierać kolory samemu korzystamy z pracy lepszych od nas
library(ggthemes)
    scale_fill_wsj() +
    theme_wsj()
    scale_fill_fivethirtyeight() +
    theme_fivethirtyeight()
Żeby było białe tło
theme(panel.background = element_rect(fill = "white"),
      plot.background = element_rect(fill = "white"),
      legend.background = element_rect(fill = "white"))
Od kopciuszka do trochę mniej kopciuszka
Nie trzeba formatować danych, żeby frakcje przedstawić jako procenty
scale_y_continuous(labels = scales::percent)
Oczywiście to samo tyczy się nie tylko samych etykietek, ale też całej osi
scale_y_log10()
Od kopciuszka do trochę mniej kopciuszka
Co jeśli etykietki na osi x na siebie nachodzą? Zaproponuję dwa rozwiązania
theme(axis.text.x = element_text(size = 18, face = "plain", angle = 90)
Można też wstawić nowe linie w tekst (wymaga transformacji danych). Tutaj w notacji pakietu dplyr
dane <- dane %>%
    mutate(kolumna_dlugie_stringi = stringr::str_wrap(kolumna_dlugie_stringi, 40))
Rysowanie strzałek i tekstów
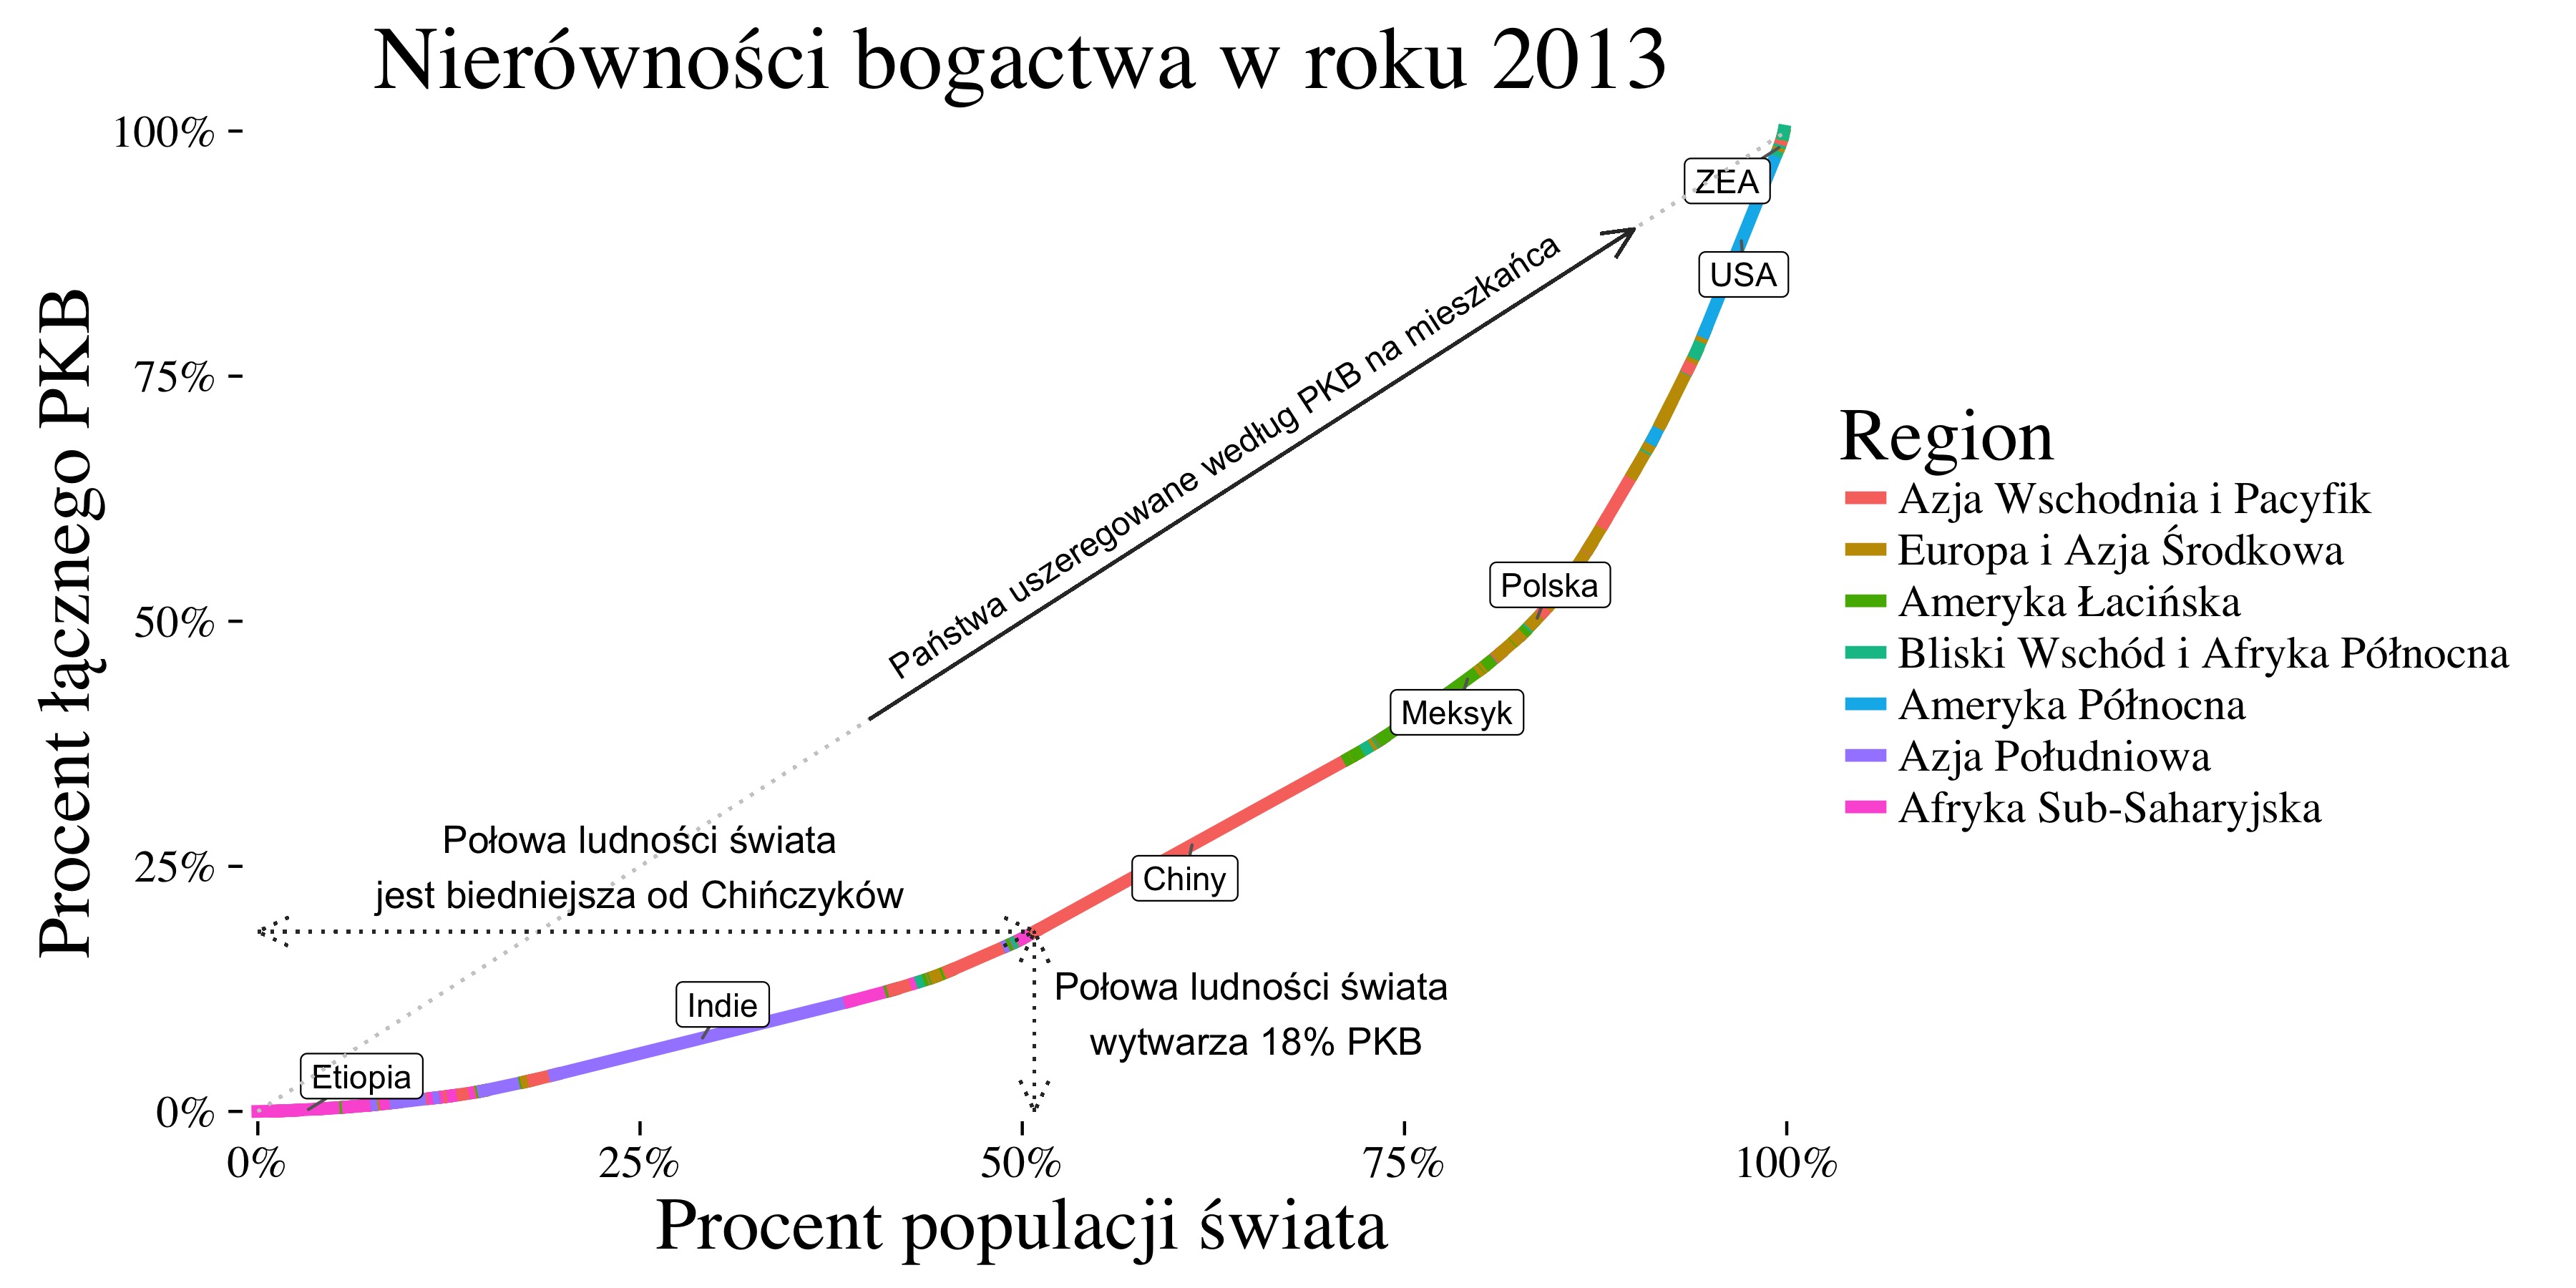
Co zrobić, żeby nie rozjeżdżały się kąty?
coord_fixed(ratio)
A jeśli chcemy odwrócić osie?
coord_flip()
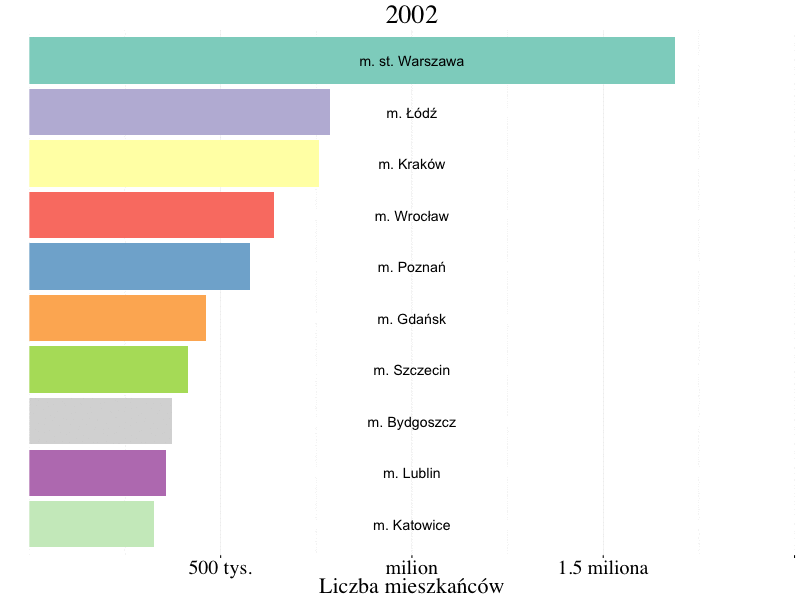
Animacje z ggplot
library(animation)

saveGIF(expr = {
    for (year0 in seq(2002, 2050, 1)){
        temp = dane %>% filter(year==year0)
        p <- ggplot(temp) +
            ...
        plot(p)
    }
}, movie.name = "nazwa.gif", interval=0.2, ani.width=800, ani.height=600)
Przejrzystość wykresu
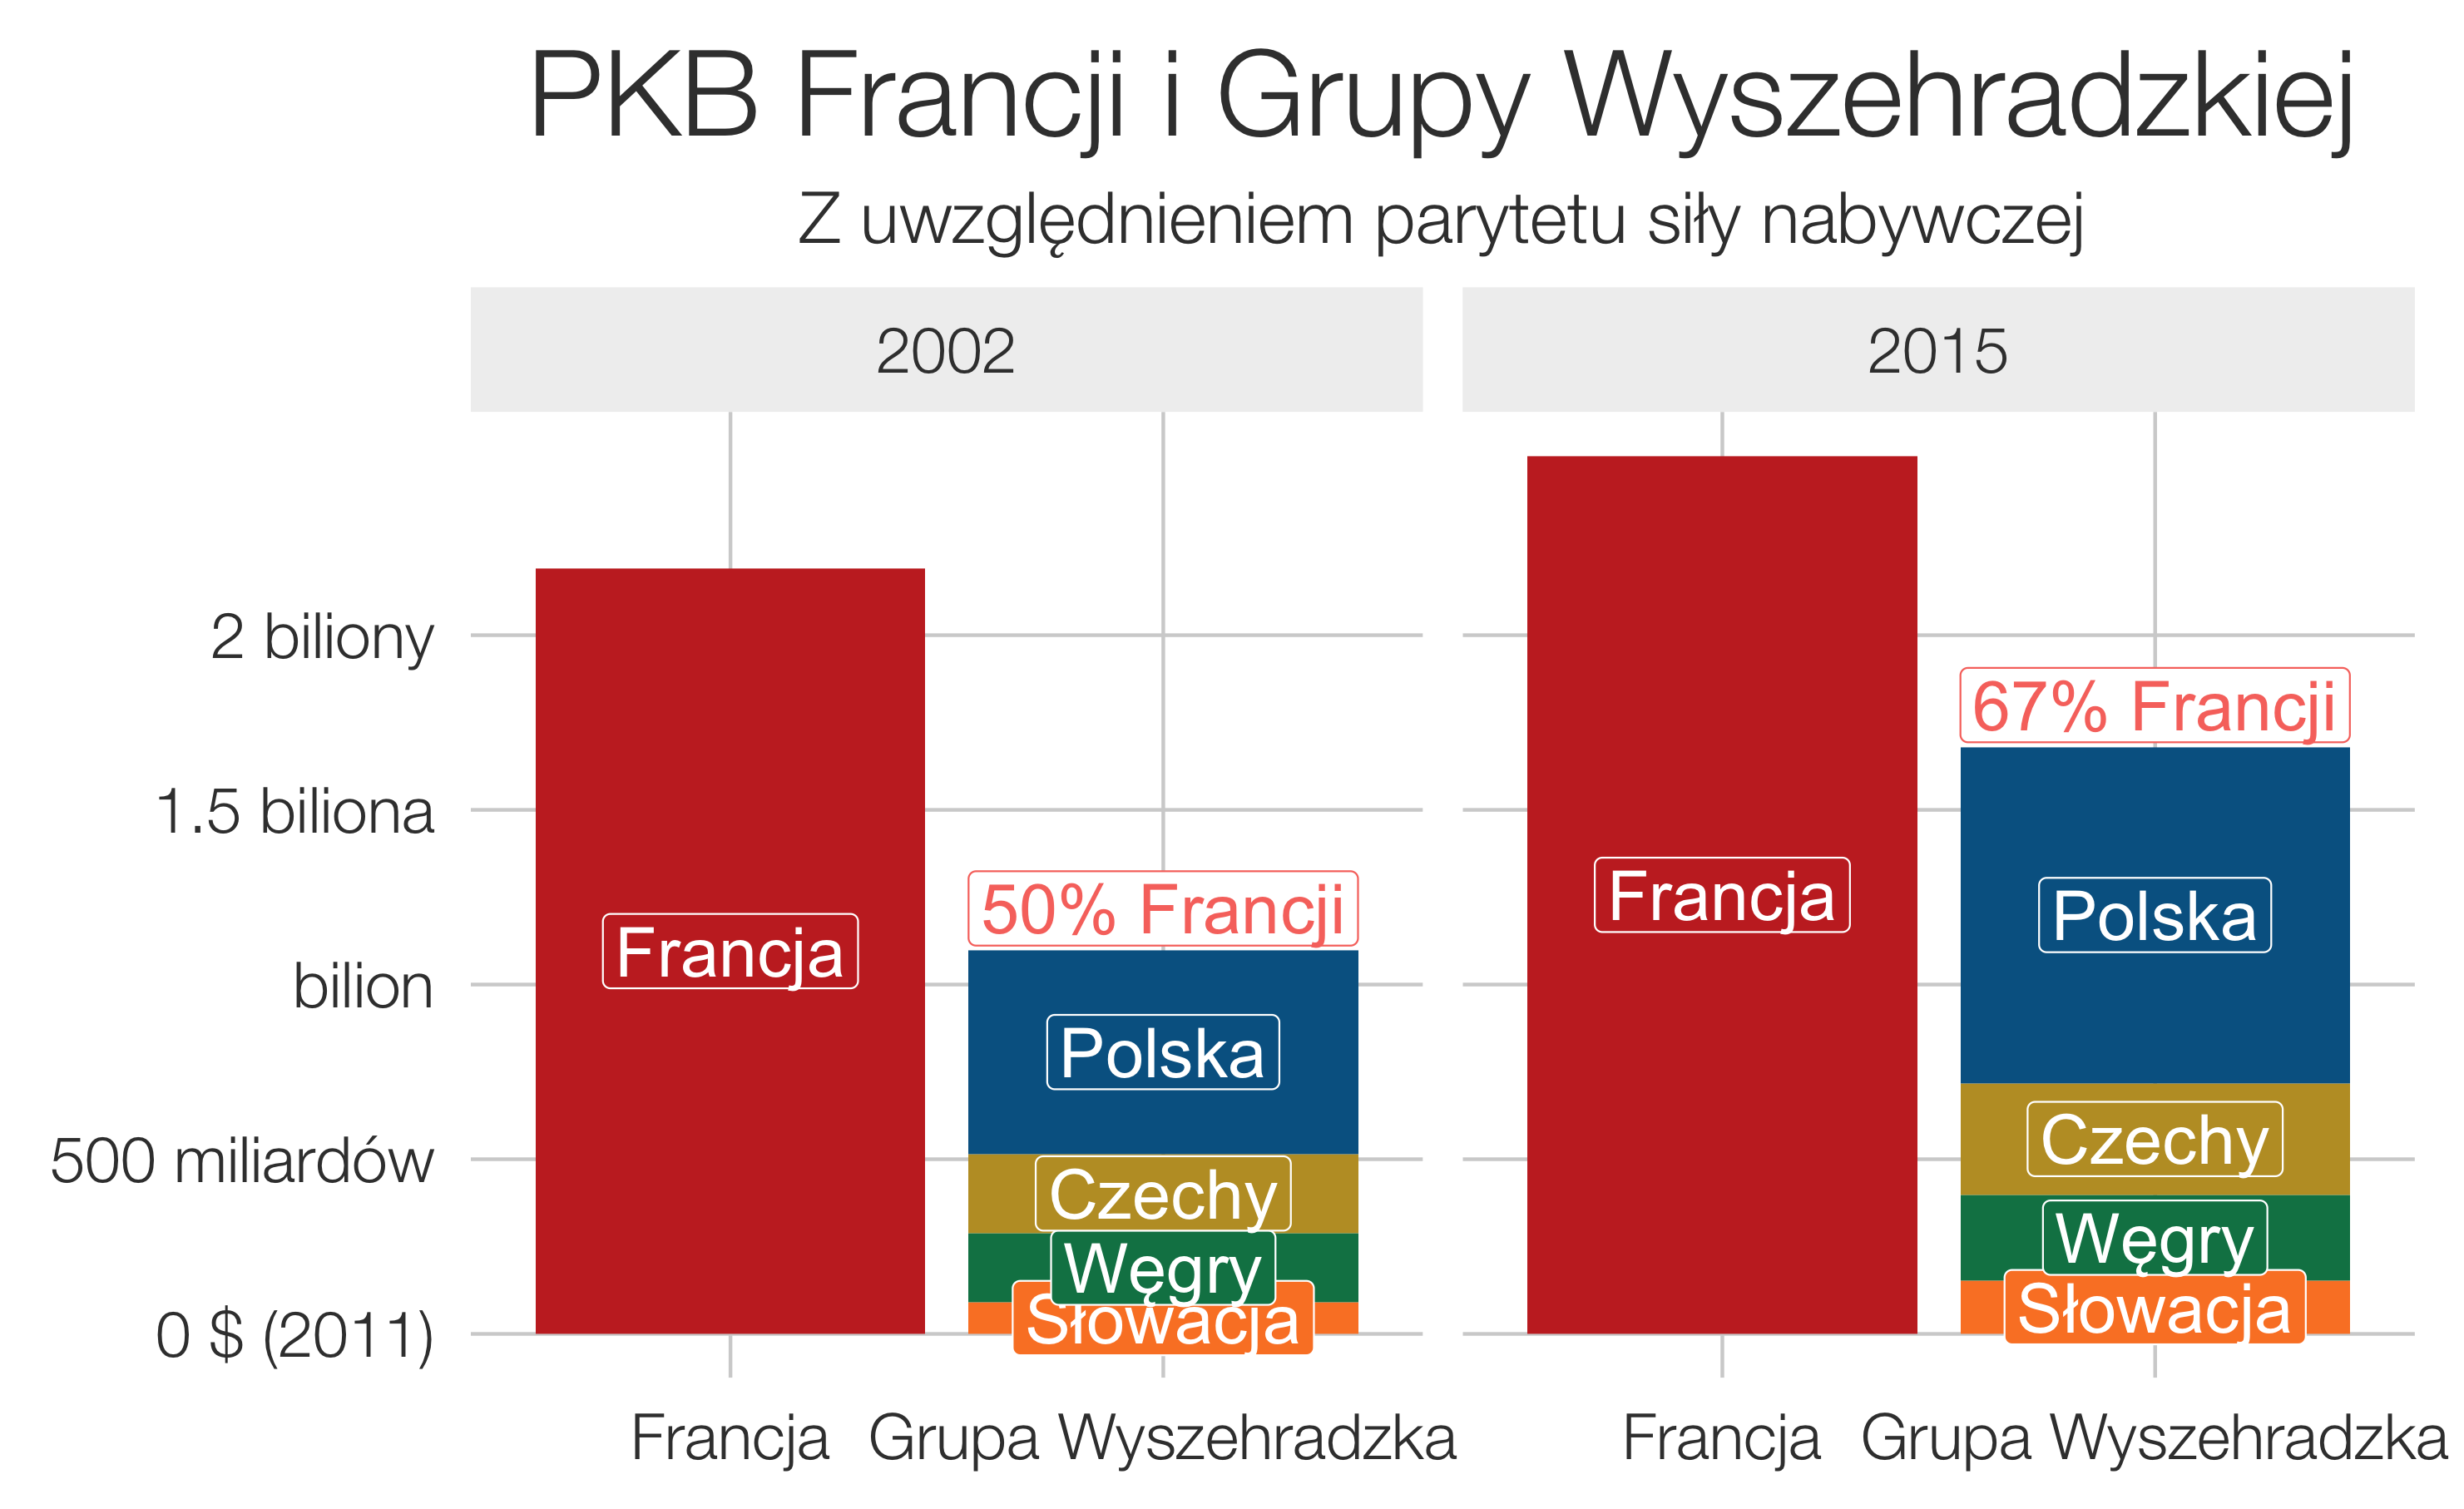
Białe etykiety na tle słupków
geom_label(aes(y=srodek, label = country), color = "white", size = 7)
Przejrzysta czcionka
theme_fivethirtyeight(base_size = 23, base_family = "Helvetica Neue Light")
Emotikony
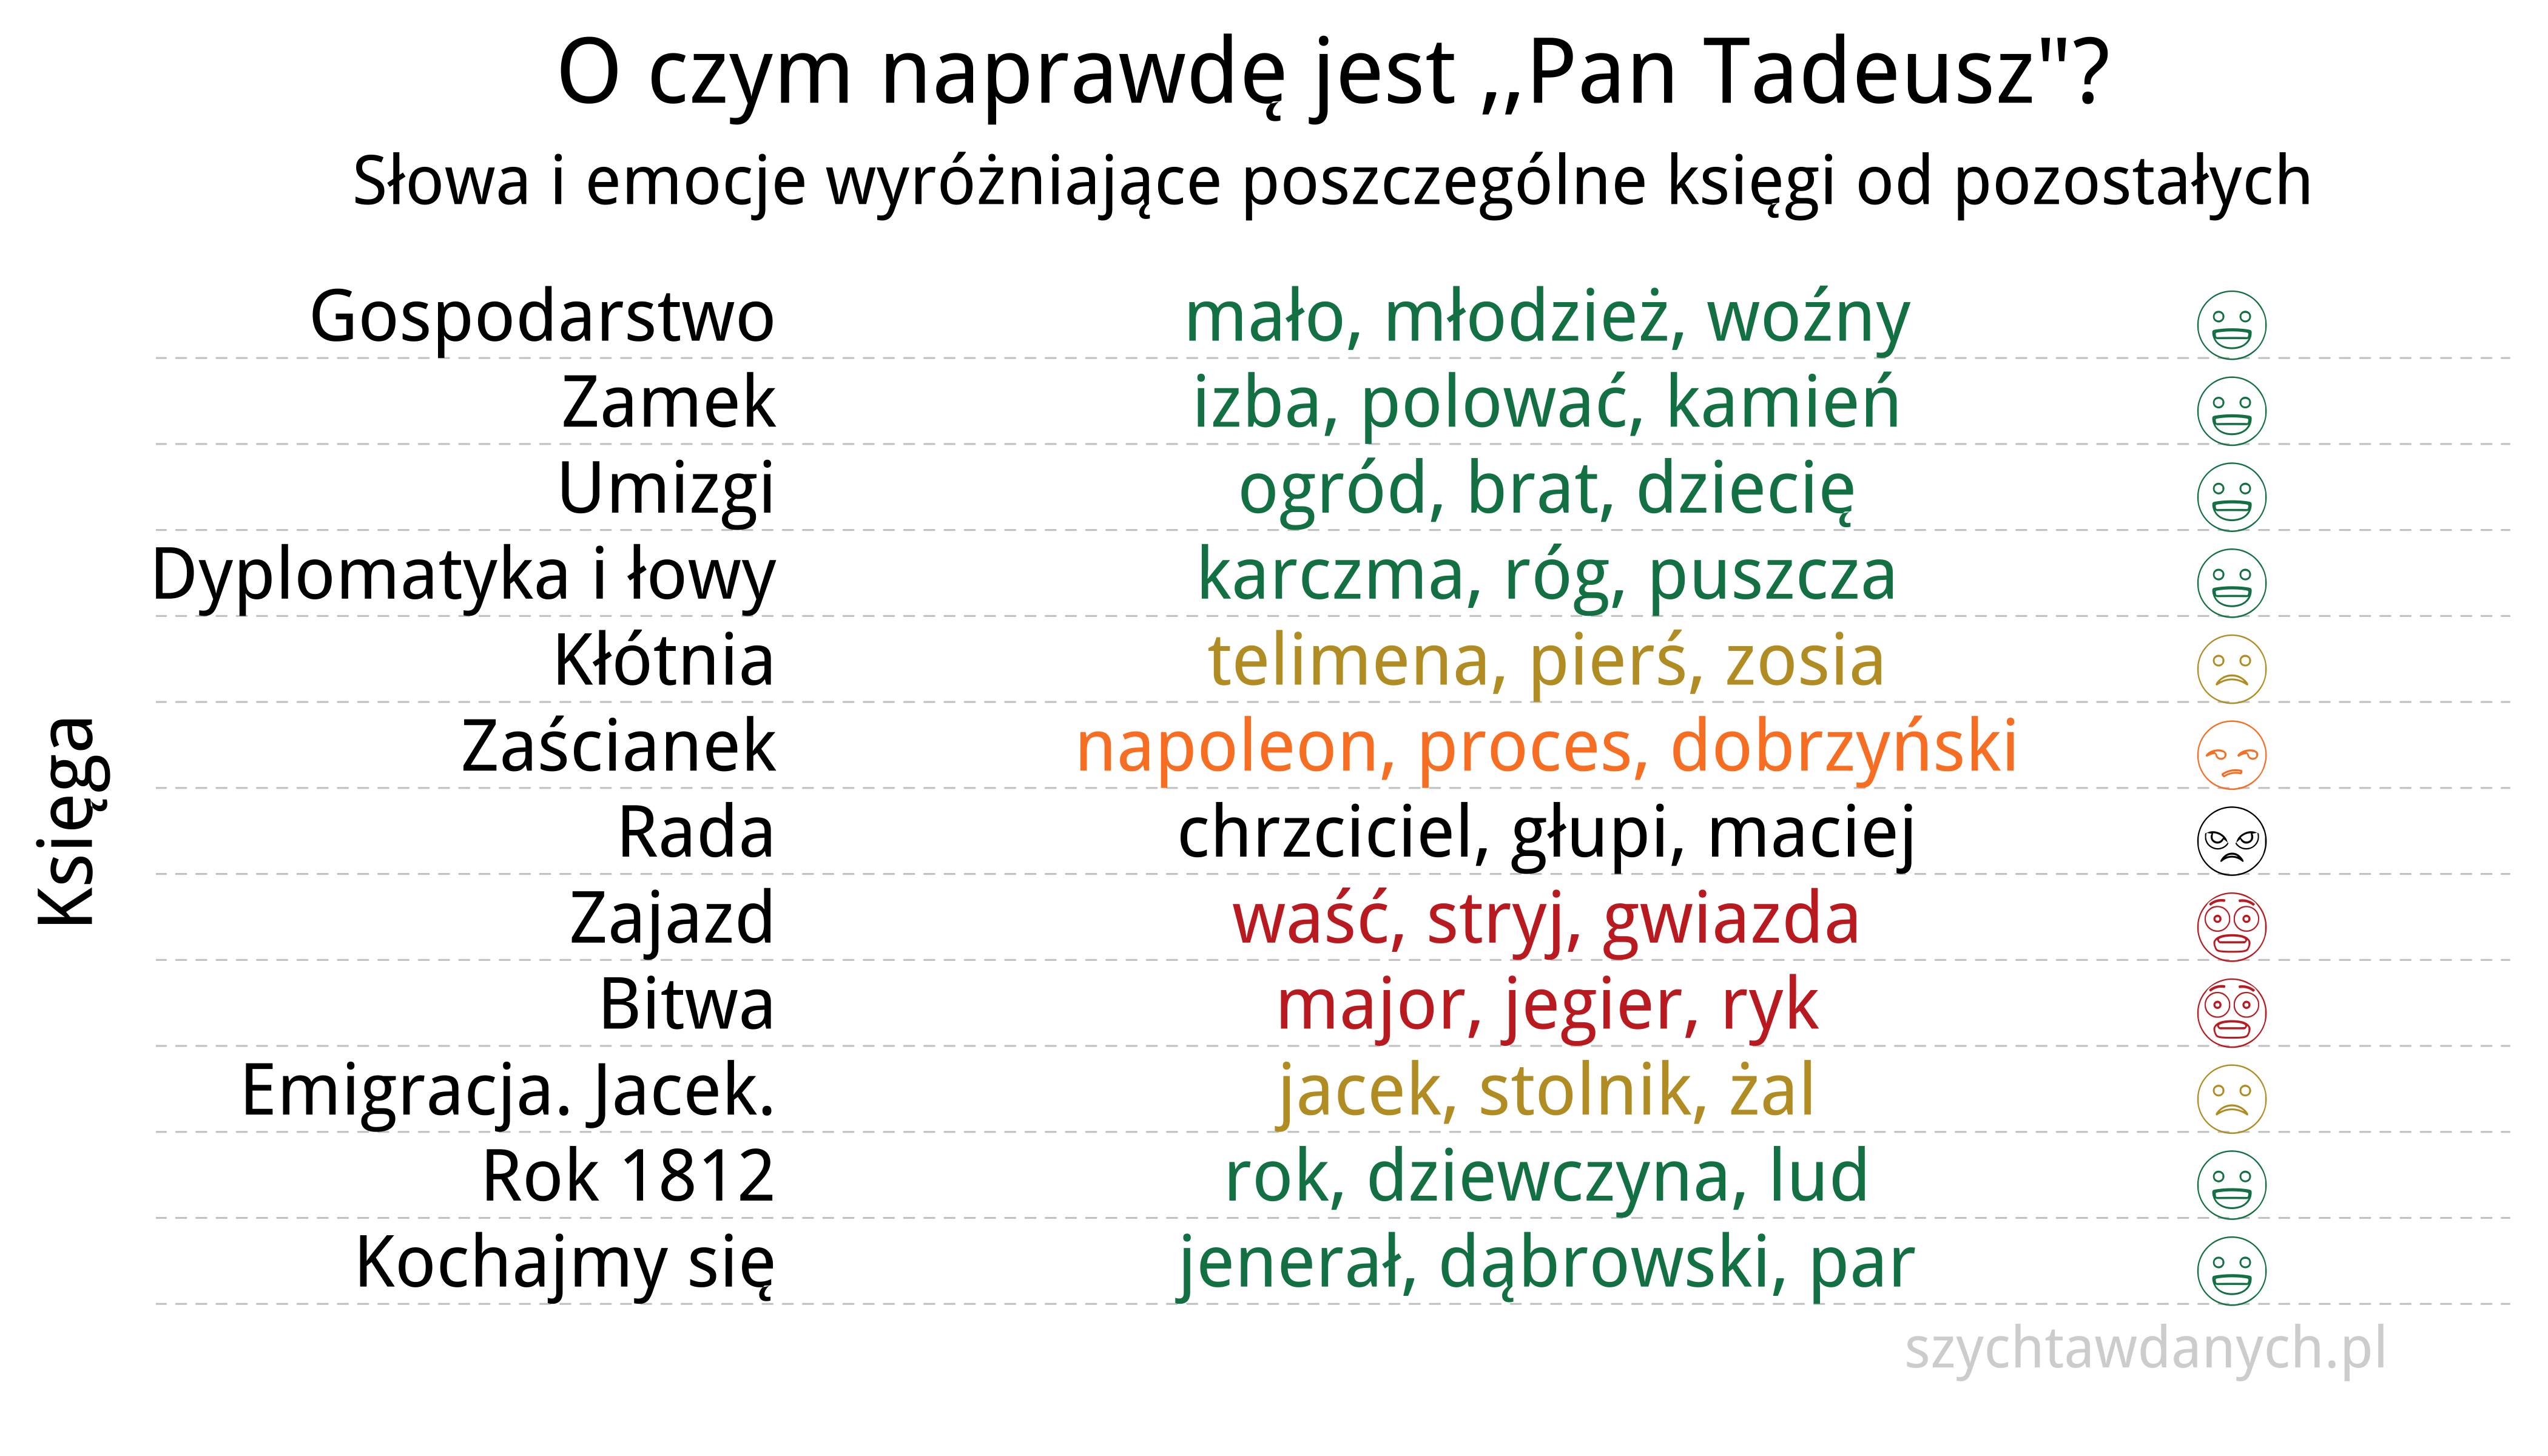
Emotikony
library(emojifont)
emoji_labels <- data.frame(emotion =  c("Happiness", "Sadness", "Disgust", "Anger", "Fear"),
                          emoji = c(emoji("smiley"), emoji("frowning_face"),
                              emoji("unamused"), emoji("angry"), emoji("fearful")),
                          emoji_name = c(("smiley"), ("frowning_face"),
                              ("unamused"), ("angry"), ("fearful")), stringsAsFactors = FALSE)
dane %>%
    inner_join(emoji_labels, by = "emotion")

plot +
    geom_text(aes(x = 13-id, y = 11, label = emoji, color = emotion),
            family = "EmojiOne", size = 11, nudge_x = 0.2) +
Mapy
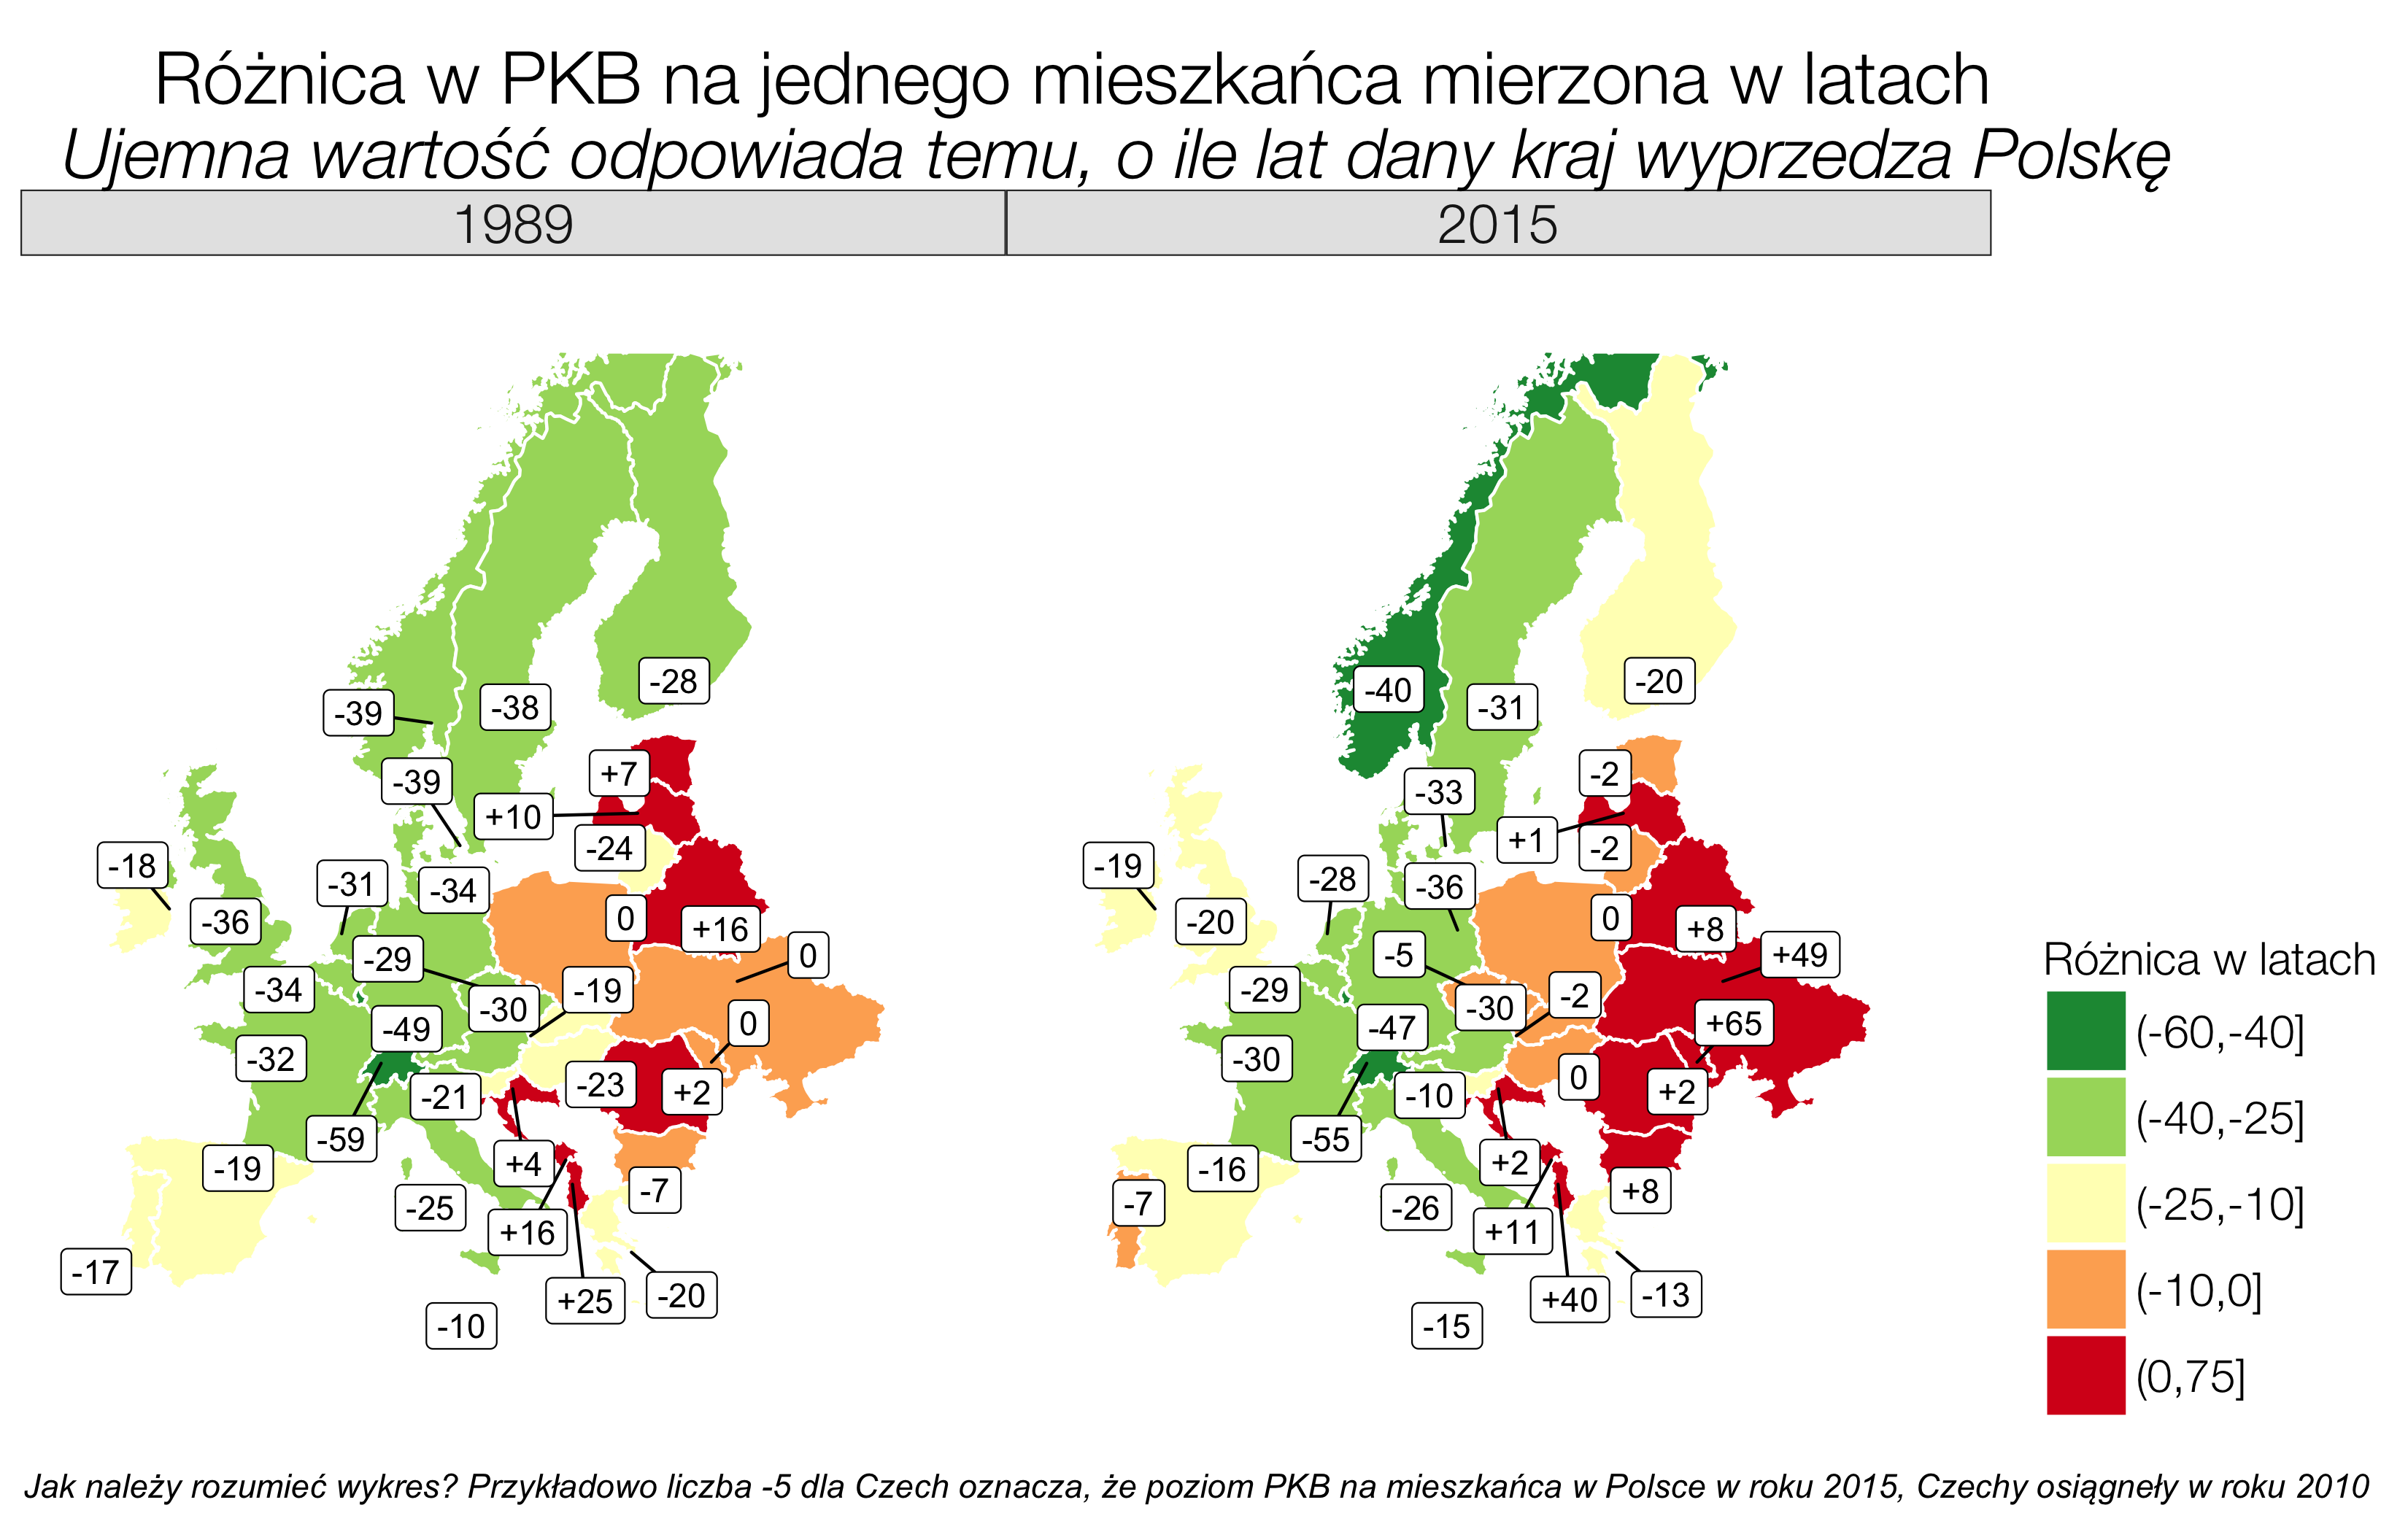
Mapy
Nienakładające się labelki
library(ggrepel)
plot +
    geom_label_repel(data = capitalsData, aes(x=LON, y=LAT,
        label=ifelse(lag>0, paste0("+", lag), lag)))
Mapy, a nie wielokąty
plot +
    coord_map()
Mapy
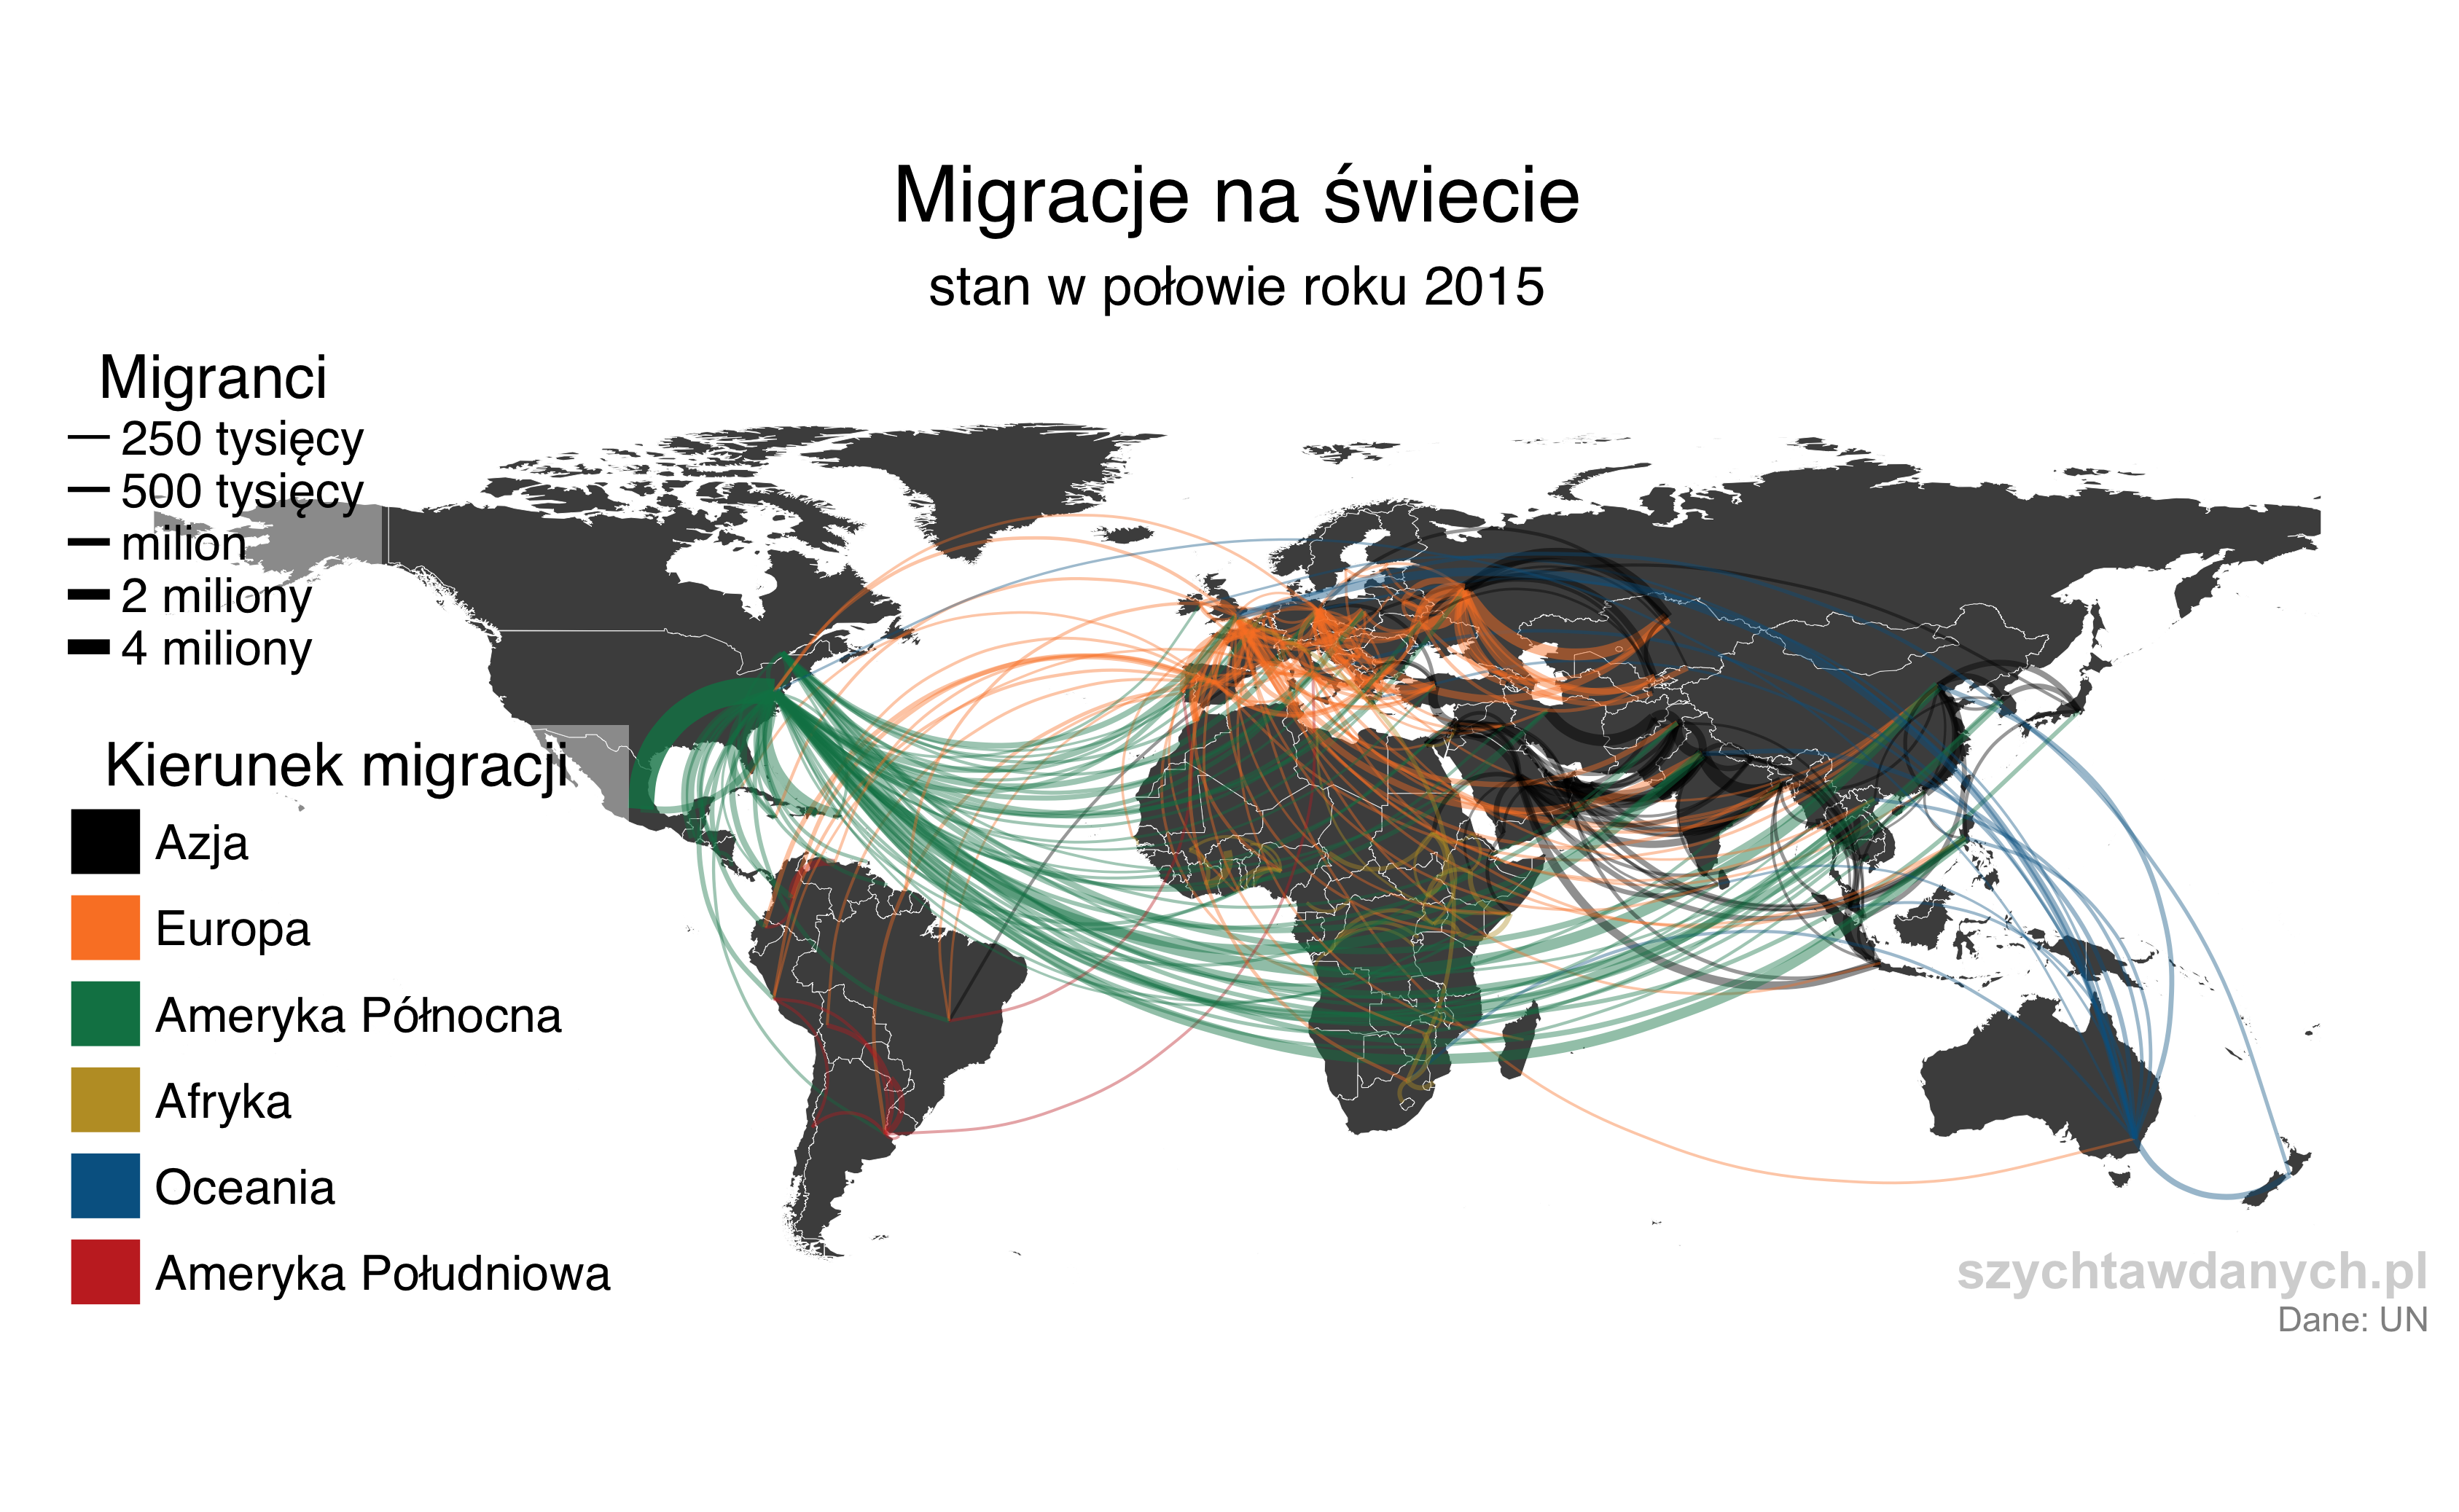
Mapy
plot +
    geom_curve(data = plotData,
                         mapping = aes(x = LON.x, y = LAT.x, xend = LON.y, yend = LAT.y,
                                                    color = continent.x, size = migrants, alpha = migrants),
                         curvature = 0.5, angle = 90, ncp = 5,
                         arrow = NULL, lineend = "butt", na.rm = FALSE, show.legend = NA) +
    coord_fixed() +
Dziękuję za uwagę
Blog http://szychtawdanych.pl/
Github https://github.com/psobczyk