Purpose:
Help People Gain Better Self-Understanding and Empowered Self-Improvement through Data
... and a self-tracker!
What Do I Track...?
 Podcast Listening: PodcastTracker.com
More on My Tracking and How I Visualize My Data
Personal Example of Improved Health.

Circa 2015.
Personal Example of Improved Health.

Circa 2017.
Part 1: How to measure a life?
Quantified Self / Self-Tracking
(def.)
Measuring or documenting something about your self to gain meaning or make improvements.
Tools for Self-Tracking / QS / Lifelogging
github.com/markwk/awesome-quantified-self
Why do People Self-Track
 www.markwk.com/why-people-self-track.html
Why Track Your Life?: Benefits of Self-Tracking
- Improved Health.
- Better Time Management
- Augment your memory.
- Save and better invest your money
- Achieve goals. Support habits. Manage projects
- Understand your mood, energy level and stress.
- Curiosity? Learn stuff about yourself.
- Personal Data is the Future.
Popular Forms of Tracking
- Weight
- Mood
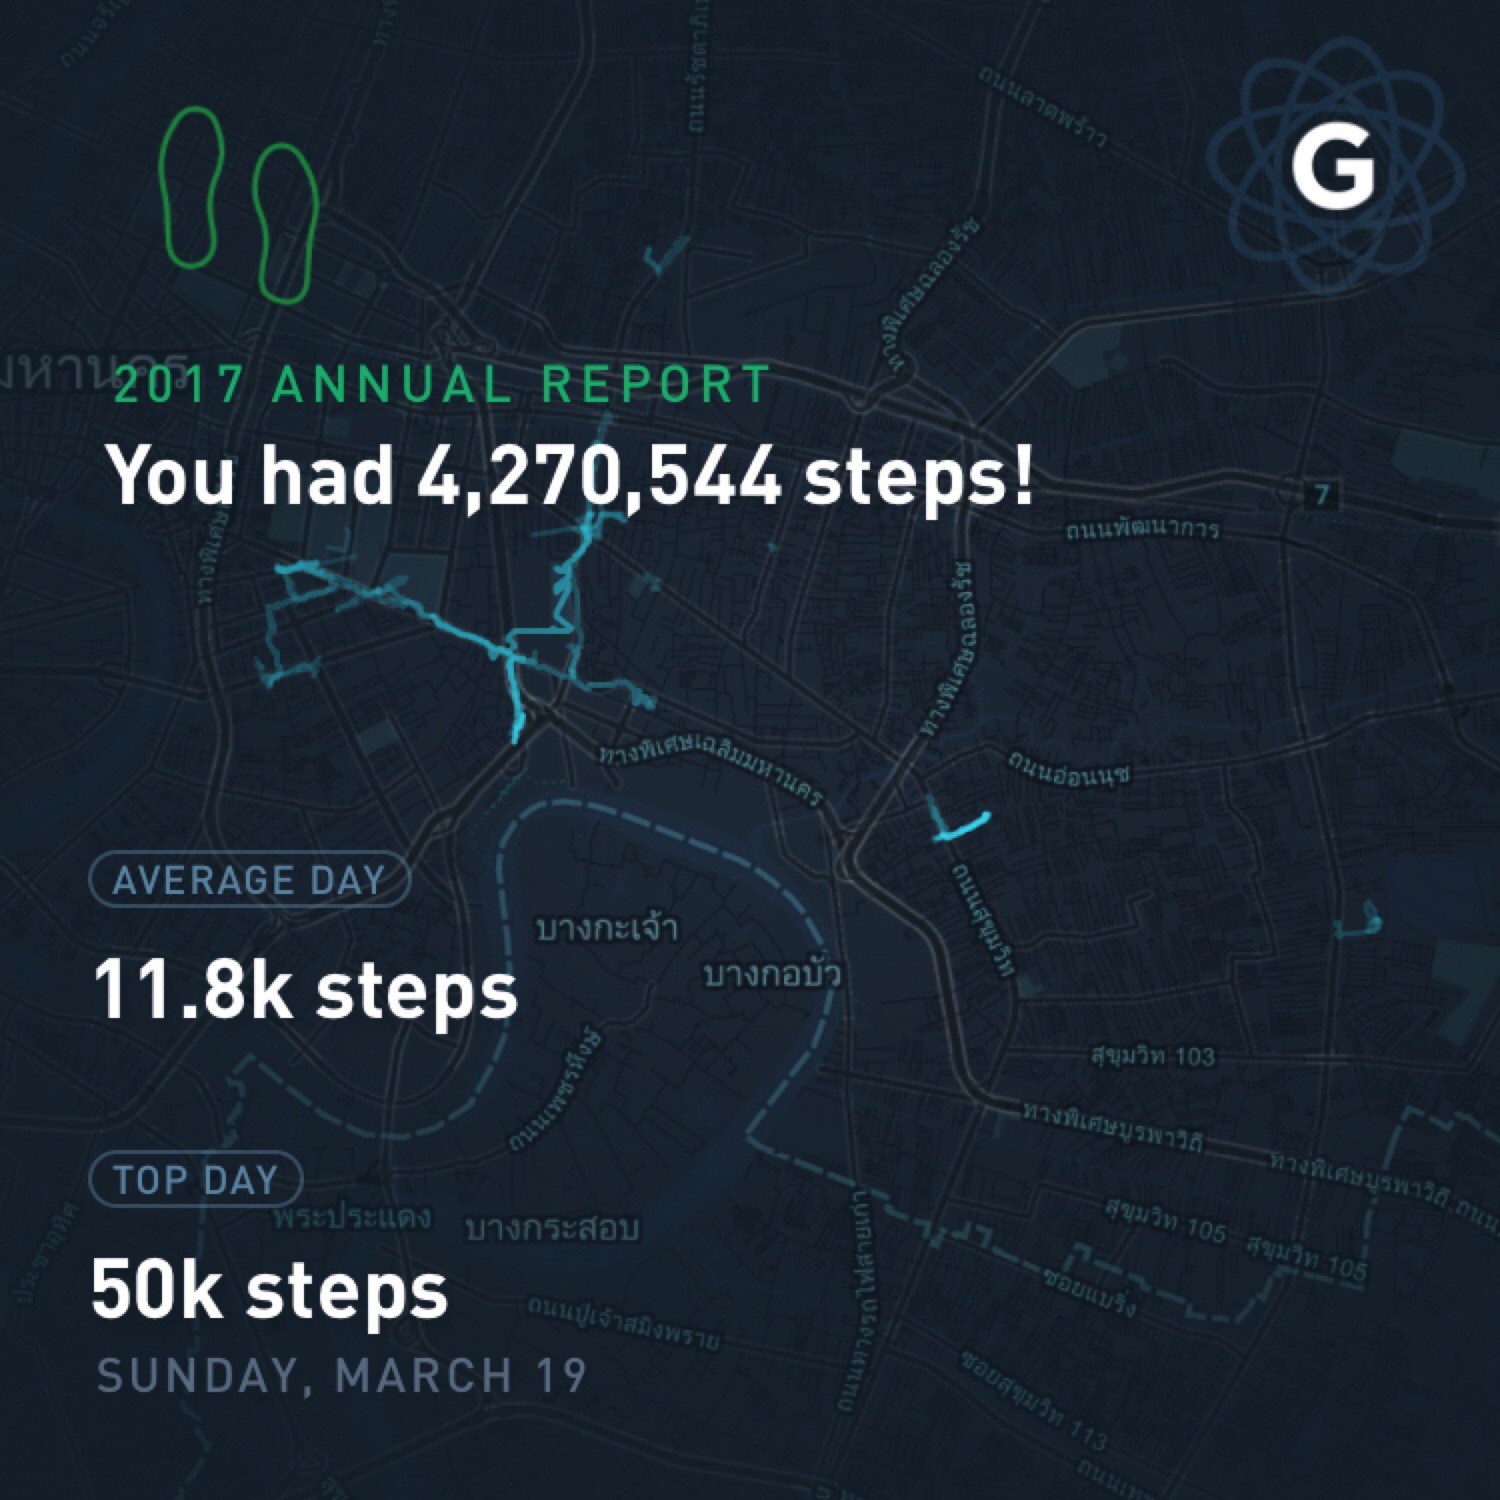
- Wearables, i.e. steps, HR, sleep, etc.
- Heart Rate: one in five Americans own a heart rate sensor today
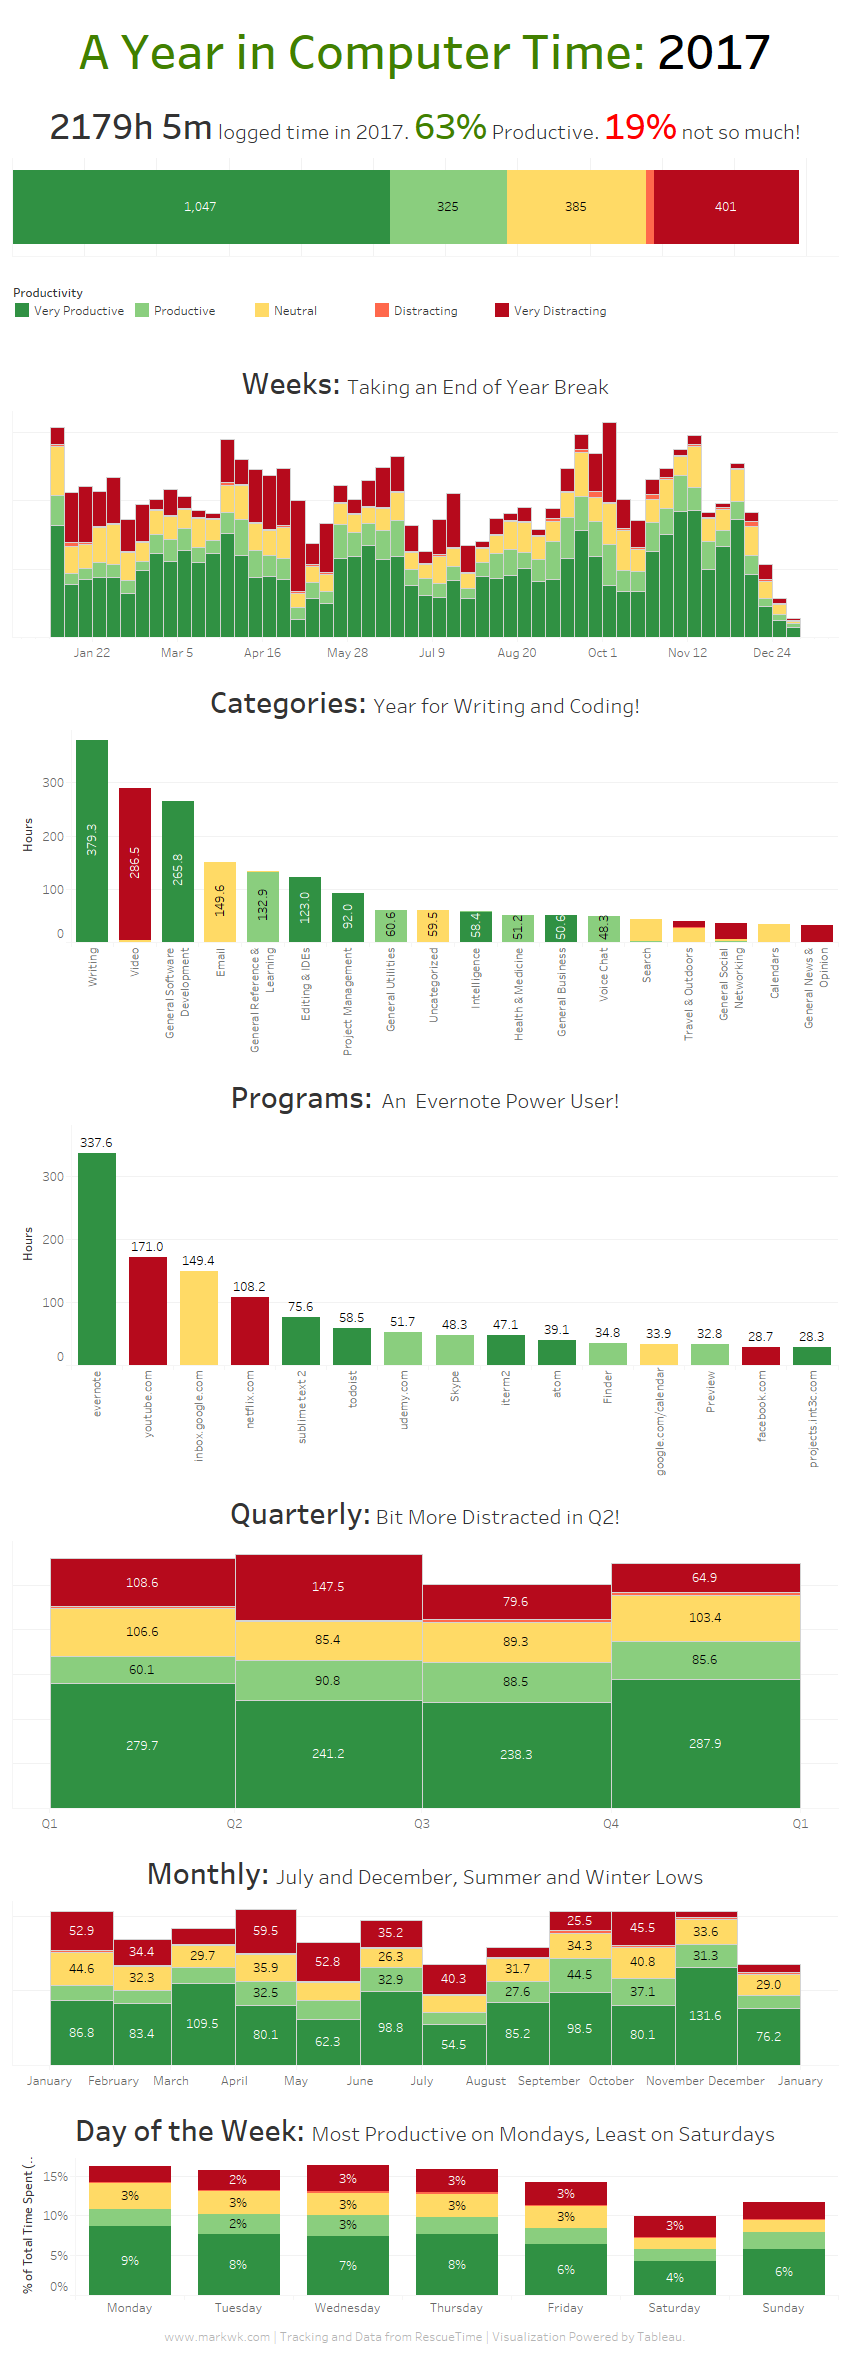
- Time Tracking
- Calendar, Project management and Tasks
- Fitness and sports
- Media Consumption: TV, music, articles, books...
- Others: Money, Blood, DNS, Microbiome,
Opportunities
in the Tracking and Personal Data Space
- Enabling and tracking new data points
=> New sensors, cheaper testing, new tracking apps, etc. - Deriving insight and meaning from existing data
=> More data and data accessibility, improved data science and machine learning, accessible ml/ai services, etc.
My Contributions and Work
Enabling and tracking new data points
- PodcastTracker.com
- PhotoStats.io
- BioMarkerTracker.com
Deriving insight and meaning from existing data
- Quantified Self (QS) Ledger
a web service to track your podcast listening and view your stats.

mobile app for iOS and Android that tracks and auto-tags your photo library, helping you understand and find your photos.
Open Source Database on Key Health Biomakers, and App for Aggregating and Storing Blood Test Results
Tip:
Start with a Question
Track It!
Python
for Self-Trackers
Part 2: Data Collection, Extraction, and Processing of Personal Data
A Personal Data Aggregator and Dashboard for Self-Trackers and Quantified Self Enthusiasts

github.com/markwk/qs_ledger
Tip:
Automate Your Data Collection into Google Sheets with IFTTT
IFTTT is a free integration service. It connects with most tracking services. Google Sheets, while limited, provides a robust first place to store your personal data.
Tip:
Engage with your Data
Whether you use Tableau, Google Sheets, Google Data Studio, Python or whatever, a personal data dashboard is one of the best ways to transform tracking data into something useful and engaging.
What is Machine Learning?
(def.)
Arthur Samuel (1959):
field of study that gives computers the ability to learn without being explicitly programmed
What is Machine Learning?
(def.)
Tom Mitchell (1998):
"A computer program is said to learn from experience E with respect to some task T and some performance measure P, if its performance on T, as measured by P, improves with experience E."
Simple Definition of Machine Learning:
Utilize past experience to learn from it and use its knowledge to make future decisions.
Classification with Deep Learning
EXAMPLE: Traveling
Artificial Neural NetworkConclusion:
Tips on How to Become a Data-Driven You
What Should You Track?
Four Essential Areas Everyone Should Track
- Health
- Time
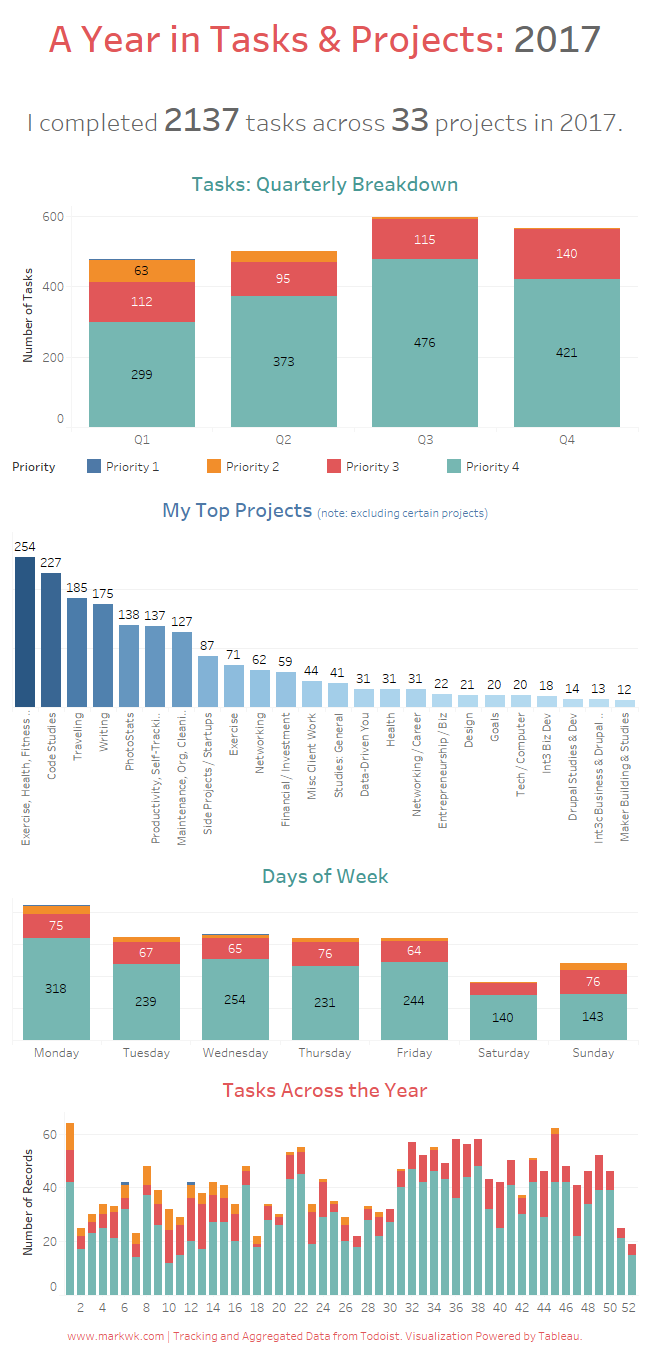
- Goals, Projects and Tasks
- Money
How to Track?
A Couple Recommendations
- Health: Baseline: Blood Tests + Sleep (and maybe HRV)
- Time: RescueTime
- Money: Mint.com
- Goals, Projects and Tasks: Todoist
QUESTION: Can personal data enable self-improvement?
Yes
But you need to engage with your data. You need to use your data, think with it, and leverage it to support your goal
Youtube History www.markwk.com/youtube-tracking.html

Youtube Time:
Question: How much time do you spend on ____?

Timezone Conversion Functions

Timezone Conversion Example: Running Workouts
