Assignment 8: AWS & Visualization
Objective
The main focus of our course is on data analytics. In fact, however, there are many other exciting topics about Big Data, which we cannot cover due to time constraints. In Lecture 8, I gave you a brief overview of AWS and Visualization. In Assignment 8, I designed some tasks aiming to deepen your understanding. After completing this assignment, you should be able to answer the following questions:
AWS
- Why Cloud Computing?
- How to launch an Amazon EC2 Instance?
- How to run an iPython Notebook Server on AWS - EC2 instance?
- What are the key concepts of S3?
- How to transfer files between S3 and a local machine?
Visualization
- Why Visualization?
- Why D3?
- How to create a static visualization using D3?
- How to create a dynamic visualization using D3?
- How to create an interactive visualization using D3?
Part 1: Amazon Web Services (AWS)
Cloud computing is well known for a pay-as-you-go model. That is, pay only for what you use. This model significantly reduces the cost of data storage and data processing, making big data techniques accessible to more and more people. Therefore, the company that you are going to work in the future is very likely to use EC2 instances for data processing and use S3 for data storage.
To help you overcome this barrier, you will learn how to use AWS EC2 and S3 in Part 1.
Task A.1: Launching an Amazon EC2 Instance (Infrastructure)
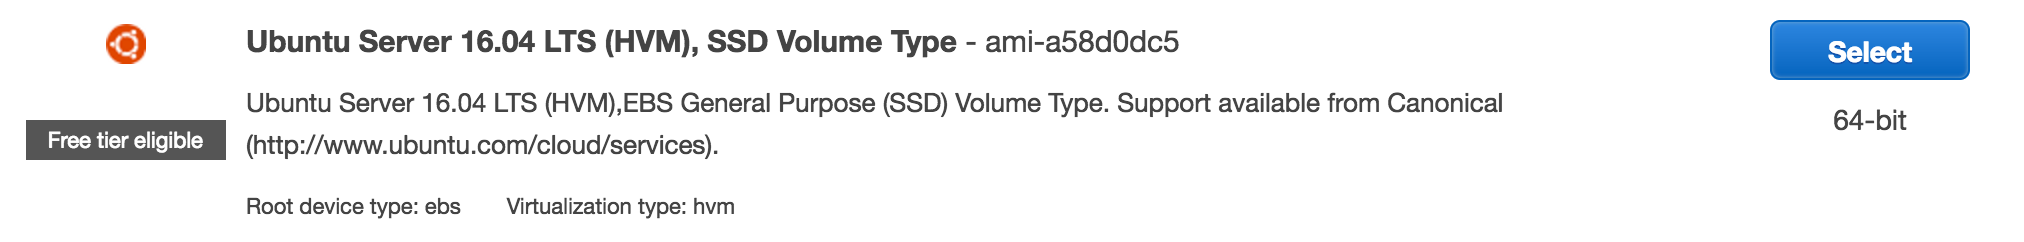
Amazon provides an AWS Free Tier that includes services with a free tier available for 12 months. Please follow "Getting Started with Amazon EC2 Linux Instances" to launch a free EC2 instance.
__Please choose the ubuntu OS system:__
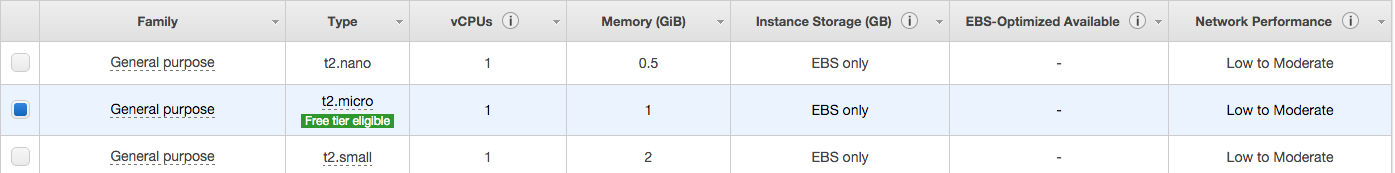
__Please choose the free t2.micro:__
Task A.2 : Running an iPython Notebook Server on EC2 (Platform)
I guess many of you may have tried iPython notebook before. In Task A.2, your job is to install an iPython notebook on the above EC2 instance and access the notebook from your own laptop. You will find that this is a SUPER cool idea because this setup allows you to (1) conduct data analysis from anywhere and (2) have scalable storage/computational resources. In fact, this kind of setup is pretty common in industry right now.
Please follow Running an iPython Notebook Server on AWS - EC2 Instance to setup the environment.
Comments:
- Pay attention to security group settings
- Install your python libraries through Anaconda Python Distribution
- Set the password to 733
- The URL should start with https
Task A.3: Transferring Files between S3 and Local Machine (Application)
Amazon S3 (Simple Storage Service) is an online file storage web service. It allows for storing data in any format, and sharing data with anyone, and downloading data from anywhere. Most importantly, it's so cheap (~0.03 per GB per month, as of 03/05/2017).
You can use S3 either with a web-based management console, or full REST APIs and SDKs (e.g., Boto 3). They are all very easy to use. But please keep in mind some basic concepts when using them.
Task Description:
The goal of this task is to give you some sense on how the S3 console and the Boto S3 API work. Please follow the following steps to finish this task.
- Download the NBA dataset to your local machine
- Create a bucket in your S3 using the S3 console (you can use any name for the bucket)
- Upload "playbyplay20120510040.zip" to the bucket
- Create a new python notebook on your EC2 instance
- In the notebook, please write a piece of code that can use the Boto 3 API to do the followings:
- Retrieve "playbyplay20120510040.zip" from S3 to your local machine
- Extract the lines that contain the word of "bryant" (ignore case). You can use the zipfile library to read the zip file directly.
- Write the extracted lines to a local file named "bryant.txt"
- Upload "bryant.txt" to the bucket that you created
Hints:
Please first install boto3 into your EC2 instance by running the following command:
conda install boto3
You should never put AWS_ACCESS_KEY_ID and AWS_SECRET_ACCESS_KEY into your code. To avoid this, you can set them as system environment variables
Please take a look at the Boto 3 Transfer Manager API
Submission:
- Please submit a URL that links to the notebook your created
Where To Go From Here (Optional)
There are a few things that you can do to improve the iPython Notebook setup:
- Apply for AWS Education Credits that allow you to launch a larger instance or a cluster of multiple instances for free
- You can launch EC2 spot instances (as worker nodes) to save cost
- Enable your iPython Notebook to support pyspark
Part 2: Dynamic Visualization with D3
Data visualization (a.k.a dataviz) is an important skill for data scientists. It can not only help the data scientists to tell a more vivid story about their findings, but also reveal interesting patterns that cannot be found through typical summary statistics.
There are a large number of dataviz tools available. In this assignment, we are going to learn Data-driven Documents (D3), one of the most popular ones. D3 is a JavaScript library for manipulating documents based on data. People may choose to use D3 for various reasons. What I like most about D3 is that it makes the creation of dynamic data visualizations on the Web become much easier. In Part 2, you will learn three methods: "transition", "selection.exit", and "selection.on" for turning a static visualization into a dynamic one.
Prerequisite: D3 Basics
The key idea behind D3 is to manipulate DOM elements in a webpage based on input data. Thus, before you create visualizations using D3, the first question is to ask what your data is; the second one is to ask what DOM elements you want to bind your data to; the third one is to ask how to update the elements to reflect the changes of data.
Here is a pretty cool tutorial. Please take a look at the first 1 hour.
from IPython.display import YouTubeVideo
YouTubeVideo("8jvoTV54nXw")
I created a static visualization (base.html) using D3. Please download it and read the source code. There shouldn't be a problem to understand the code if you have watched the video.
"base.html" will be your starting point. The goal of the following tasks is to make "base.html" become dynamic using three different methods. While these tasks look a little useless from a data analysis point of view, you can easily extend them to more realistic charts (e.g., replacing each character with a bar).
Task B. Dynamic Visualization using "transition"
In Task B, you need to modify the "base.html" file to make the visualization behave as follows.

At the beginning, the text is on the left side and it is in black color. After waiting for 1 sec, it moves from left to right by 100px, where the duration time is 1 sec. Once it arrives at the right side, the color of each character is changed from black to its original color. Please note that the above gif figure will repeat the move, but you only need to move it ONCE.
Hints:
- Please take a look at Transitions
Submission:
- Name your file as B.html, and submit it to the CourSys activity Assignment 8
Task C. Dynamic Visualization using "selection.exit"
In Task C, you need to modify the "base.html" file to make the visualization behave as follows.

At the beginning, there is no text. Every 0.5 sec, there is a new character (including space) showing up from left to right. Once all the characters show up, each character will disappear one by one from right to left (every 0.5 sec). Please note that the above gif figure will repeat this process, but you only need to do it ONCE. That is, once all the characters disappear, there is no more change to the visualization.
Hints:
- Please take a look at Examples 65-67 in the above tutorial.
Submission:
- Name your file as C.html, and submit it to the CourSys activity Assignment 8
Task D. Dynamic Visualization using "selection.on"
In Task D, you need to modify the "base.html" file to make the visualization behave as follows.

At the beginning, all characters are in black color. Once you move the mouse over each character, the color of the character changes from black to its original color. Once you move the mouse out the character, the color changes to black after waiting for 1 sec.
Submission:
- Name your file as D.html, and submit it to the CourSys activity Assignment 8
Where To Go From Here (Optional)
Here are some good resources to continue your study on D3:
- Learning by books: D3 Tutorial, Interactive Data Visualization for the Web
- Learning by examples: D3 Gallery
- D3 is a low-level visualization tool (think of it as MapReduce). There are many high-level tools built upon D3 (think of them as Spark, HIVE, etc.). Here are some good ones: Vega, d3.chart, and mpld3.
Submission
In summary, you need to complete one task on AWS and three tasks on D3. Please submit the notebook URL, B.html, C.html, and D.html to the CourSys activity Assignment 8.