
When you are developing an application, there are times when you will need to debug your code. When you are stepping through your code line by line the debugger will sometimes jump into a source file that you are not working in. This could be a third-party library you are using for instance. The lines of code in that library are not what you are trying to debug, so stepping through that code is not important to you. If you have ever had to do this before while debugging an application you know how much of a pain this is. It can take a long time for you to step through the code in a library before you get back to stepping through the code you are developing.
This is where blackboxing scripts becomes useful. When you blackbox a source file, you will not jump into that file when stepping through code you're debugging. You are able to debug just the code you are most interested in.
When a script is not blackboxed, it is likely something like this will happen:

There are two ways you can add scripts to the blackbox blacklist:
Use the Settings panel to configure blackboxed scripts. Open the DevTools Settings and under Sources click Manage framework blackboxing.
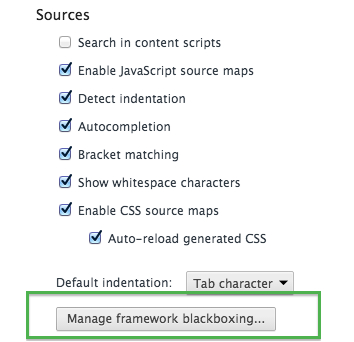
This will open up a dialog where you can input file names of scripts that you would like to add to the blacklist. You can do this a couple of ways:
/backbone\.js$,\.min\.js$bower_components.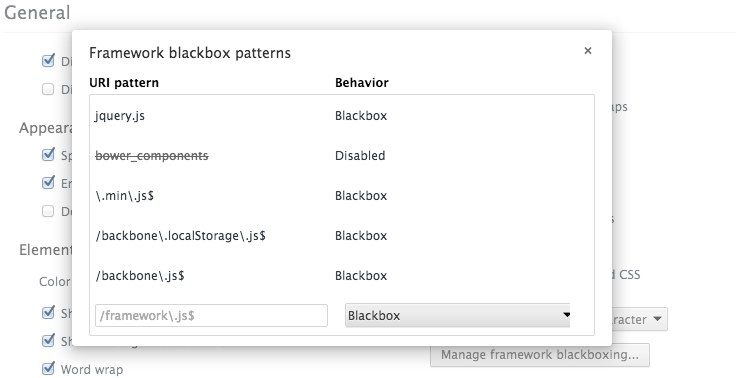
You may want to temporarily unblackbox a rule for testing purposes. You can do this by changing the behavior to Disabled. If you wanted to remove a rule entirely you can click X to delete it.
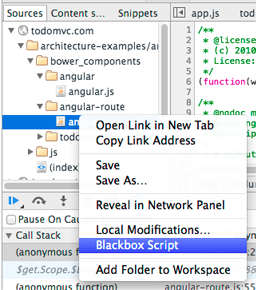
To use the Settings panel for adding files to the blacklist, you can use the context menu when working in the Sources panel. When viewing a file you can right-click in the editor. And you can right-click on a file in the file navigator. From there choose Blackbox Script. This will add the file to the list in the Settings panel.
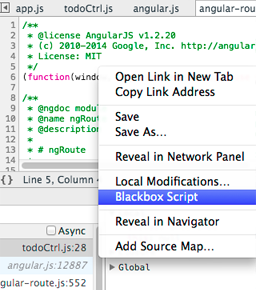
When you view a blackboxed script in the editor on the Sources panel, you will see a yellow bar indicating that it's blackboxed. Clicking on more expands the bar showing a bit more info about what it means, and how you can disable it.

When paused on a breakpoint, in the call stack you will see a message stating the number of frames which are blackboxed. You can show these frames if you want, but since they are calls made from a blackboxed script they are hidden unless you click show.
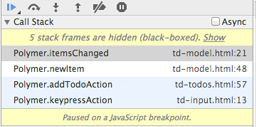
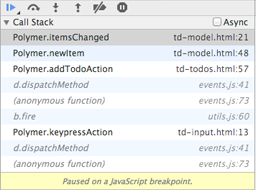
The end result is you are debugging your application code instead of third party resources.
Blackboxing scripts can help increase your productivity and help keep your focus on the code you care about. It is easy to enable using any workflow and just as easy to disable if the need to do so arises.
We want to make sure your debugging experience when working with JS frameworks is excellent. Please file a ticket after trying blackboxing if you have ideas on how it can be improved or address your use cases better.