MLExpResso – NGS, Metylacja, Expresja, R i sporo kawy
Aleksandra Dąbrowska
Alicja Gosiewska
29.09.2017
Grupa MI2 i MI2 DataLab
“MLGenSig: Machine Learning Methods for building the Integrated Genetic Signatures” NCN Opus grant 2016/21/B/ST6/02176
Terminologia biologiczna
Podstawowe pojęcia
- Gen
- Ekspresja genu
- Sonda mikromacierzy
- Metylacja DNA
Nazwa
Ekspresja
Testowanie
BRCA_exp[1:5, 1:5] SUBTYPE AANAT AARSD1 AATF AATK
TCGA-A1-A0SB-01A-11R-A144-07 Normal 9 2354 2870 317
TCGA-A1-A0SD-01A-11R-A115-07 LumA 2 1846 5656 312
TCGA-A1-A0SE-01A-11R-A084-07 LumA 11 3391 9522 736
TCGA-A1-A0SF-01A-11R-A144-07 LumA 0 2169 4625 169
TCGA-A1-A0SG-01A-11R-A144-07 LumA 1 2273 3473 92calculate_test(data, condition, test) id log2.fold pval mean_LumA mean_other mean
1 AURKB 2.339920 3.191000e-32 539.0426 2323.8868 1485.01
2 CBX2 2.895062 2.834335e-26 632.5106 4296.6038 2574.48
3 KPNA2 1.447288 8.551812e-24 11547.36 26427.38 19433.77
4 PRR11 3.822148 2.286874e-22 396.383 3479.981 2030.69
5 BIRC5 1.988998 1.953941e-21 1957.085 6658.358 4448.76
6 GSG2 1.405039 3.527773e-21 278.2128 629.3396 464.31Volcano plot
plot_volcano(data, line, names, fold_line)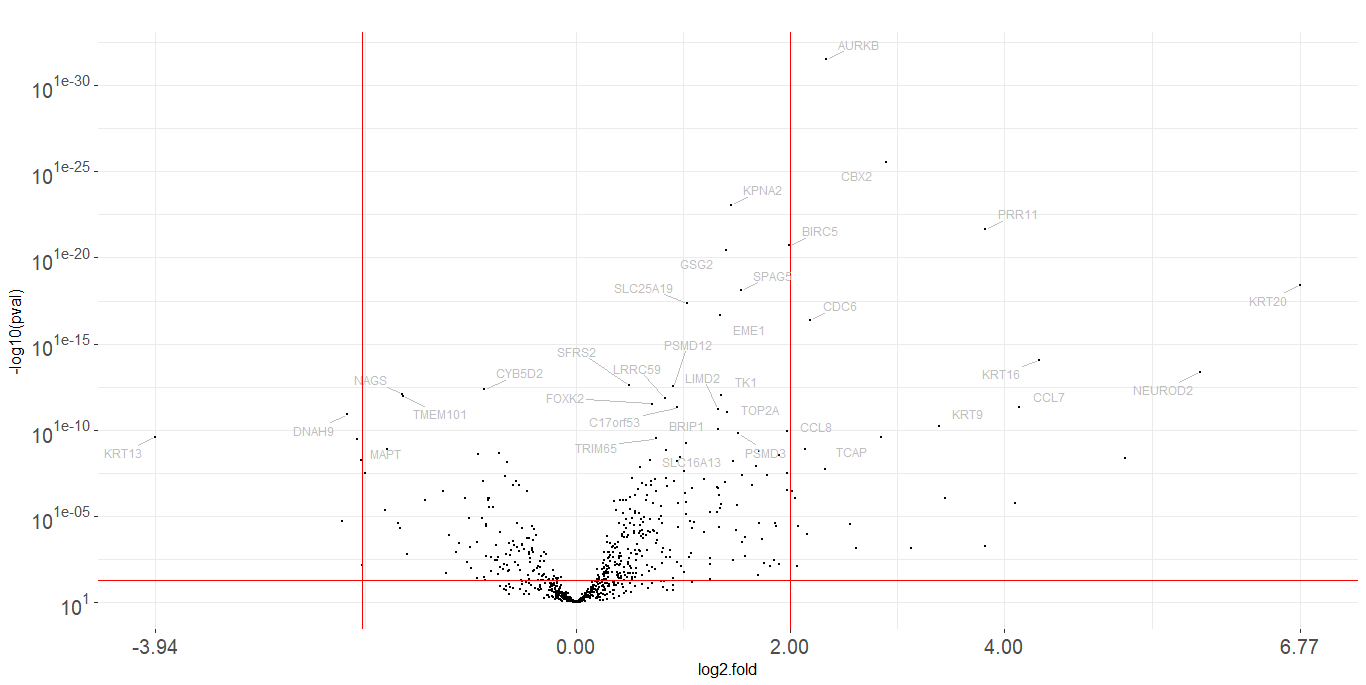
Metylacja
Agregacja sond do genów
BRCA_met[1:5, 1:4] SUBTYPE cg00021527 cg00031162 cg00032227
TCGA-A1-A0SD-01A-11D-A112-05 LumA 0.03781858 0.7910348 0.006391233
TCGA-A2-A04N-01A-11D-A112-05 LumA 0.01437552 0.7359370 0.008752293
TCGA-A2-A04P-01A-31D-A032-05 Basal 0.01360124 0.6967802 0.009442039
TCGA-A2-A04Q-01A-21D-A032-05 Basal 0.01525656 0.5341244 0.014674247
TCGA-A2-A04T-01A-21D-A032-05 Basal 0.01167384 0.7378100 0.012251559BRCA_met_gen <- aggregate_probes(data) BRCA_met_gen[1:5, 1:4] AANAT AARSD1 AATF AATK
TCGA-A1-A0SD-01A-11D-A112-05 0.7148533 0.8625816 0.24294092 0.7835302
TCGA-A2-A04N-01A-11D-A112-05 0.5850106 0.8355825 0.21367129 0.8466190
TCGA-A2-A04P-01A-31D-A032-05 0.4495537 0.8786166 0.03277413 0.3417919
TCGA-A2-A04Q-01A-21D-A032-05 0.7120650 0.8819490 0.03460160 0.7264985
TCGA-A2-A04T-01A-21D-A032-05 0.6010397 0.7739978 0.02501599 0.6276399Methylation path
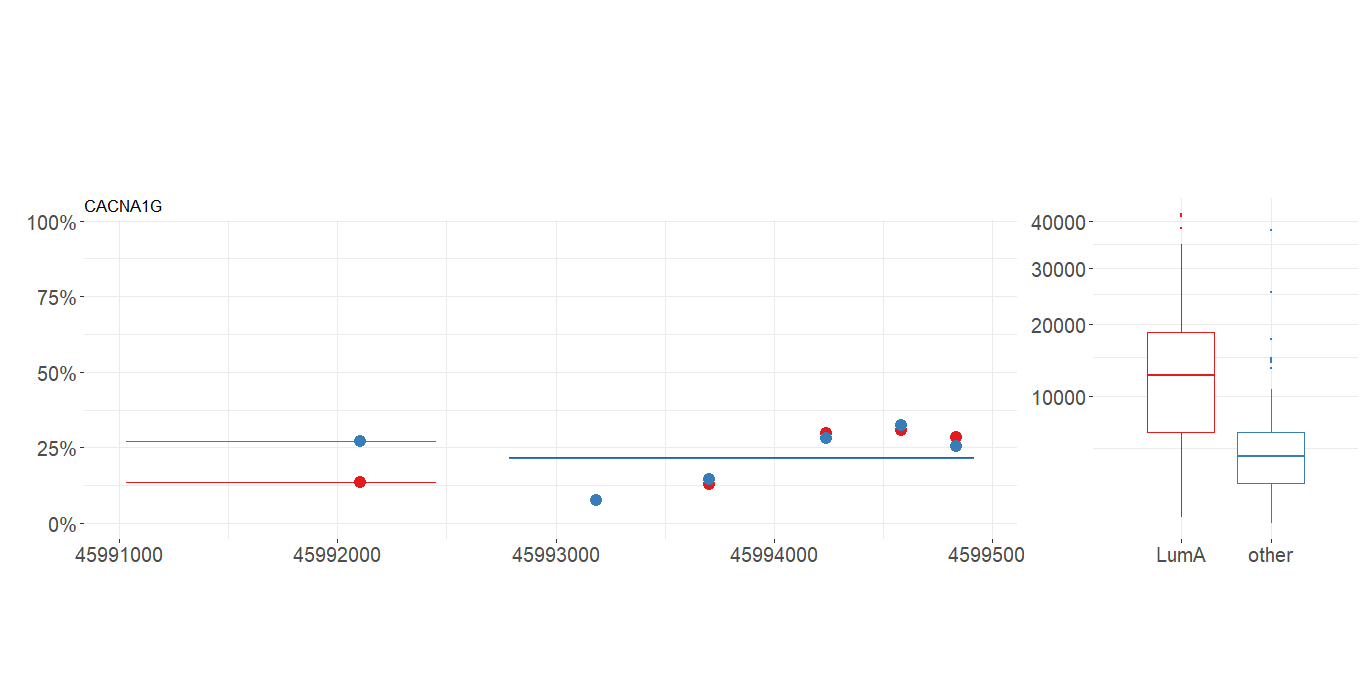
plot_methylation_path(data, condition, gene, show.gene, observ)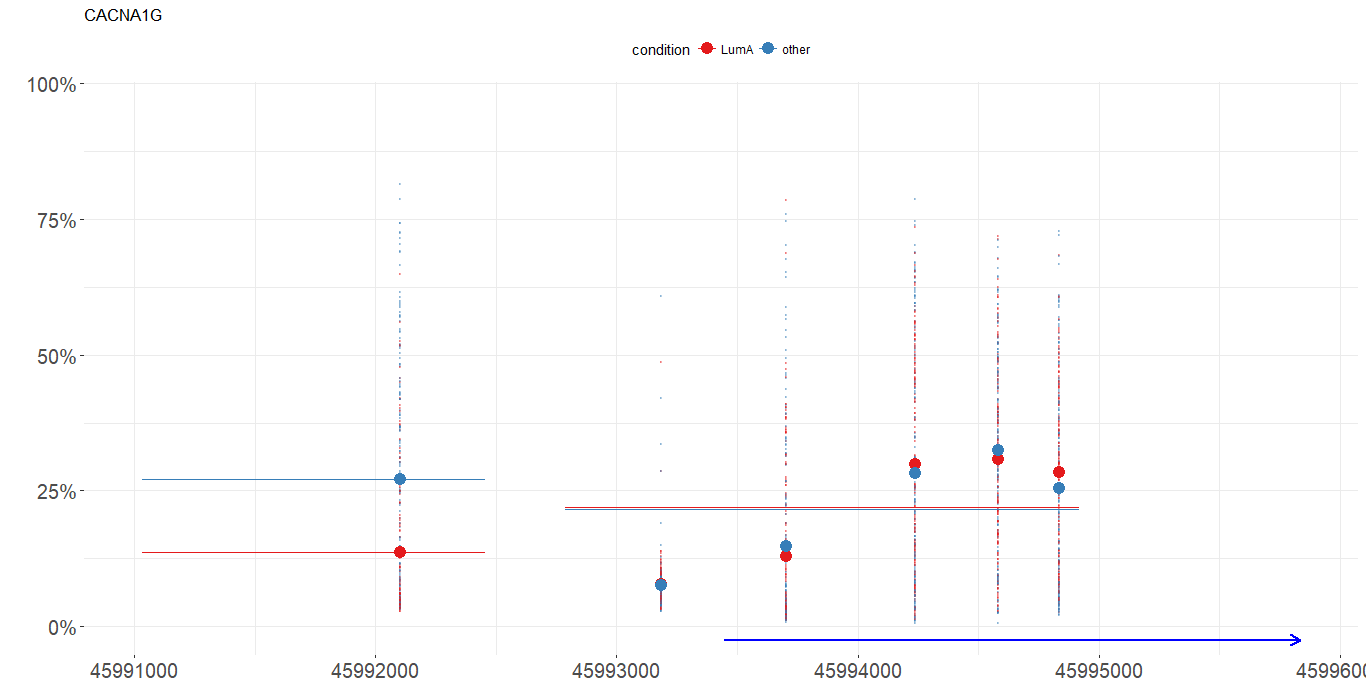
Testowanie
calculate_test(data, condition, test) id log2.fold pval mean_LumA mean_other
1 ICAM2 -0.15151320 3.754116e-17 0.2547275 0.4062407
2 RILP -0.05073691 2.575168e-13 0.3079069 0.3586438
3 PIPOX 0.11505558 5.360053e-12 0.4242804 0.3092248
4 TNFSF12 -0.13412855 5.867083e-12 0.1791401 0.3132686
5 CD7 0.09822690 1.641919e-11 0.8635077 0.7652808Integracja ekspresji i metylacji
Tabela porównań
comparison <- calculate_comparison_table(data1, data2, condition1,
condition2, test1, test2)head(comparison) id nbinom2.log2.fold nbinom2.pval ttest.log2.fold ttest.pval geom.mean.rank no.probes
59 AURKB 2.360714 1.704243e-37 0.0017389592 2.077252e-01 1.881527e-19 2
102 CBX2 2.905397 5.402147e-31 0.0584687549 1.214043e-06 8.098418e-19 2
327 KPNA2 1.466181 3.396674e-26 0.0012105971 7.505750e-01 1.596702e-13 1
277 GSG2 1.426569 3.325659e-25 -0.0018566938 2.411495e-01 2.831926e-13 2
66 BIRC5 2.004989 9.482155e-24 -0.0005444811 5.330216e-01 2.248153e-12 1
334 KRT16 4.333332 4.102956e-19 0.0486814033 1.606151e-05 2.567093e-12 2Volcano plots
plot_volcanoes(data.m, data.e,
               condition.m, condition.e,
               gene, test.m, test.e)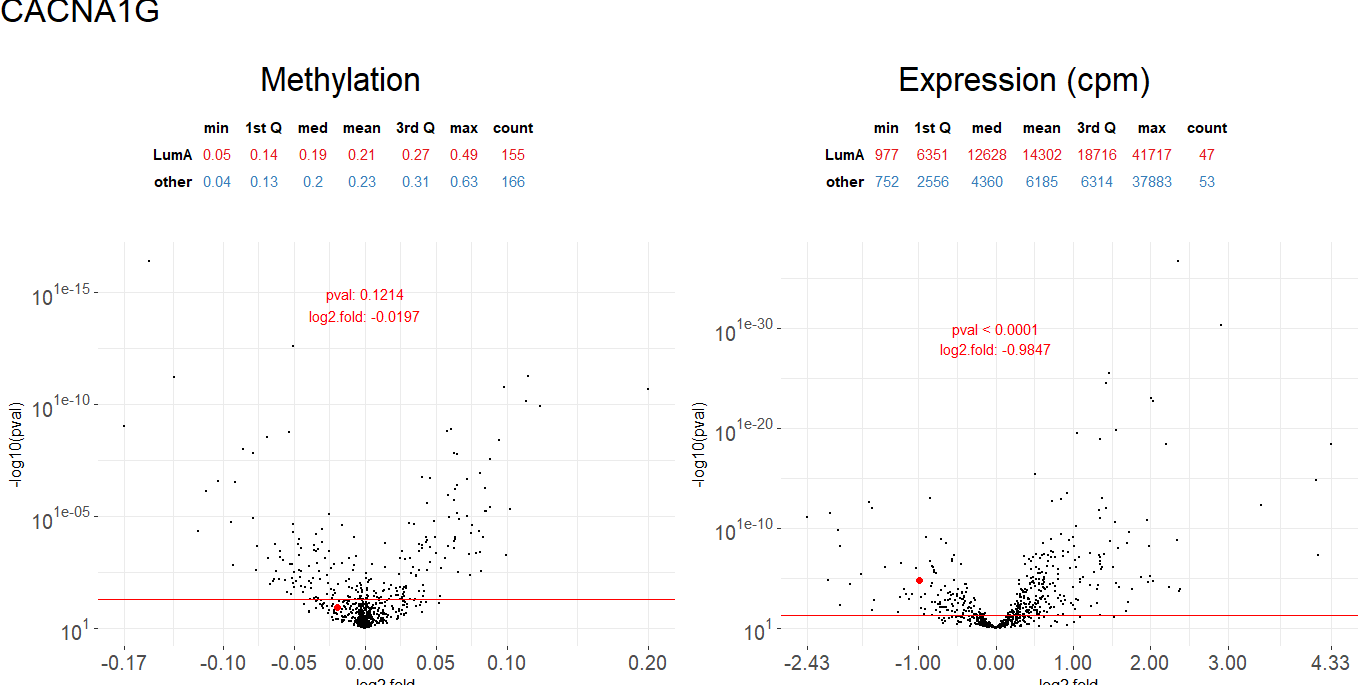
Informacje dla wybranego genu
plot_gene(data.m, data.e,
               condition.m, condition.e,
               gene, show.gene, observ, islands)