Flooding
Approximately 25% of Oregonians live in floodplains. Despite the increased management and regulation of rivers, flooding remains a risk throughout most of the state, particularly west of the Cascades. Understanding the impacts of historic floods and surveying at-risk areas can aid hazard planning and response.
Created by Gareth Baldrica-Franklin, Institute for Water and Watersheds, Oregon State University
"... and a morning dawned when there was not a sign of civilization left to tell where Champoeg had stood."
from The Oregonian, February 21, 1988, reprinted in Oregon Historical Quarterly
1861 Flood
The city of Champoeg was not the only victim of the massive flooding that struck the Willamette Valley between November and December, 1861. The flood marked either the end for Linn City, Santiam and Orleans, which were growing towns throughout the valley. USGS estimates place floodwater at its highest (near Oregon City) 55 feet above base level, and at flows of approximately 590,000 cubic feet per second (cfs). These flow rates are almost 5 times greater than Willamette River average discharge.
It is thought to the largest Willamette flood in the past 200 years.

Towns Destroyed
Flood Extent
Select to view
"Remember. Dikes are safe at present. You will be warned if necessary. You will have time to leave. Don't get excited."
from a flyer provided by the Housing Authority of Portland on the morning of Memorial Day, 1948.
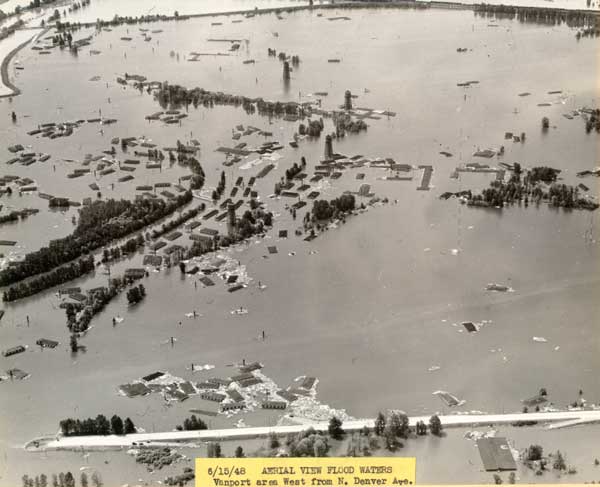
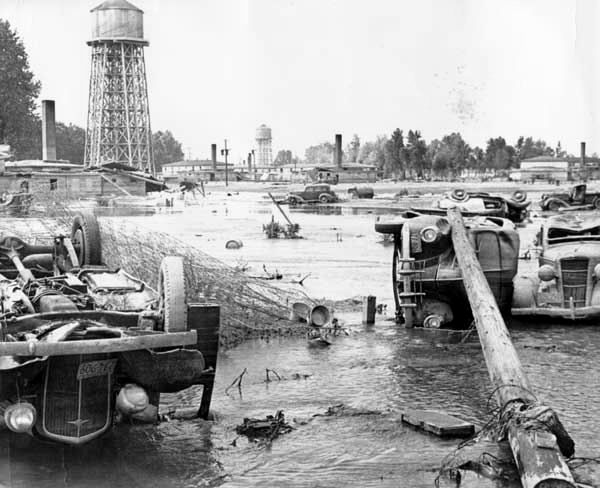
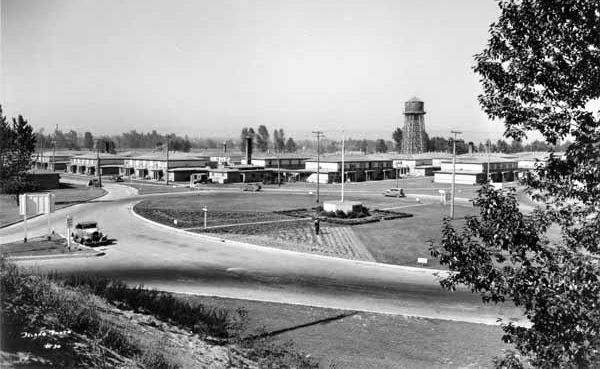
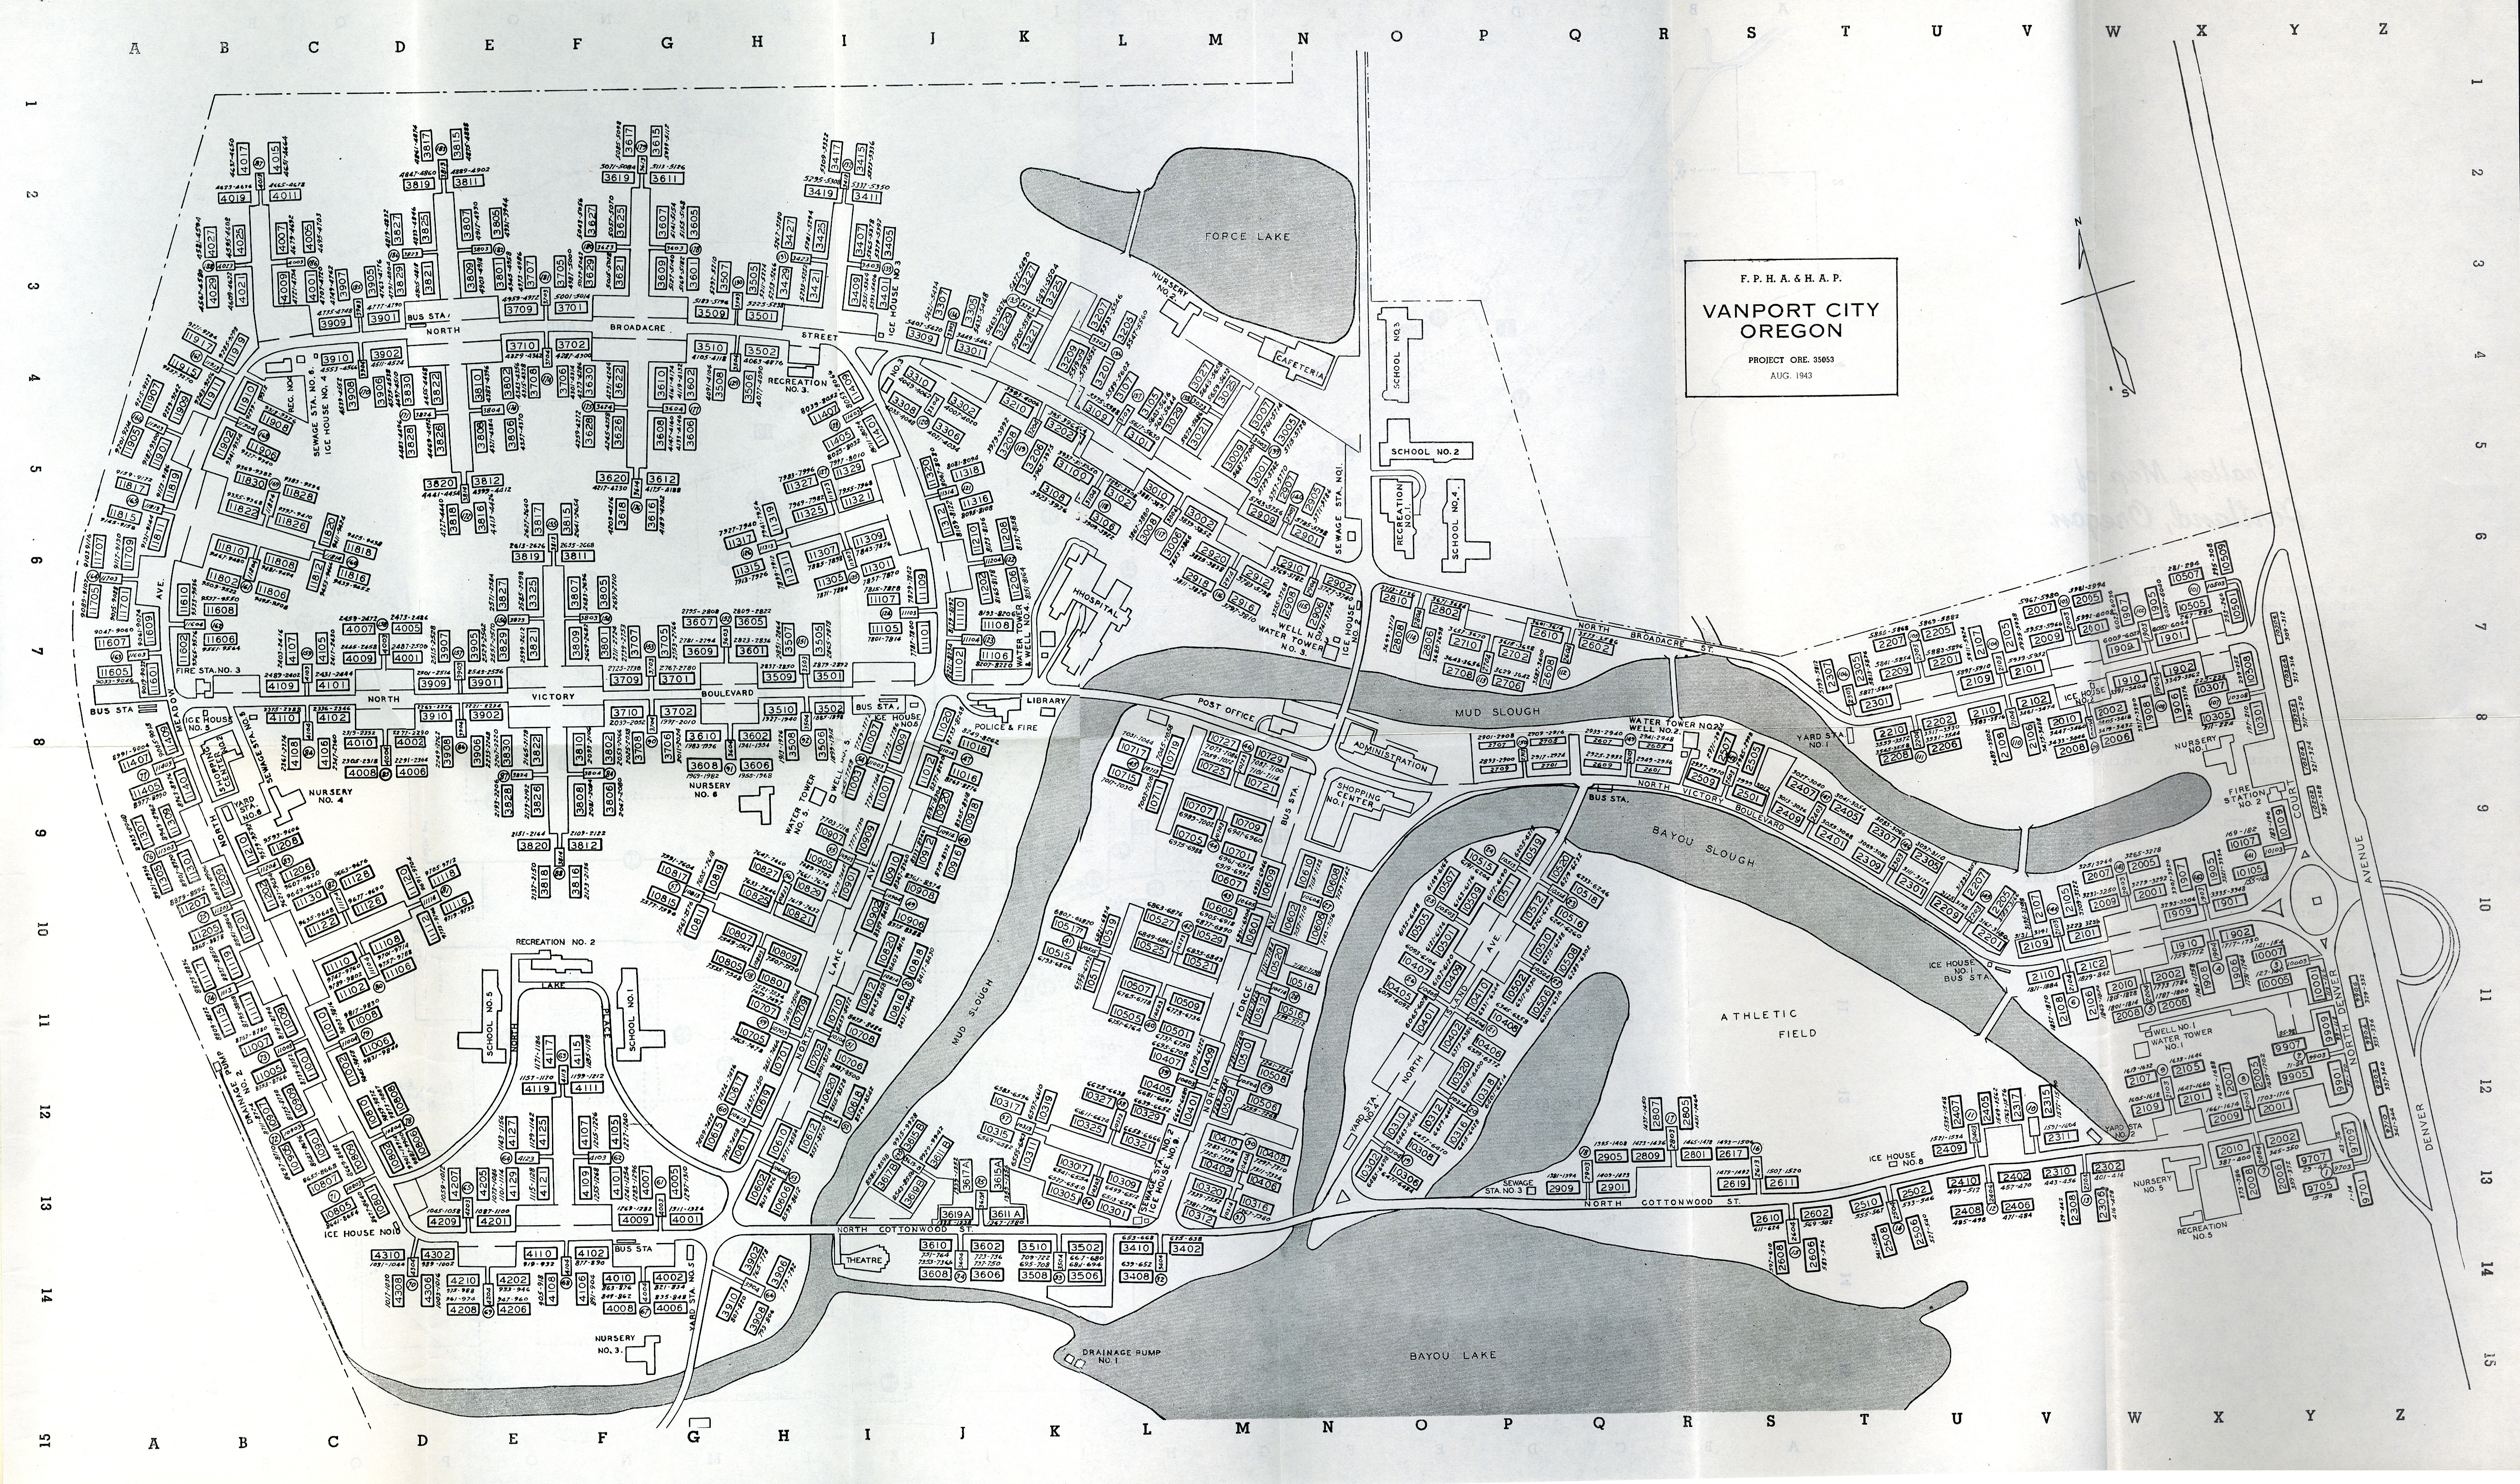
Vanport 1948
The Vanport flood was one of the most catastrophic events in Oregon history, fundamentally altering the foundation of race relations in Portland (and Oregon) forever.
In the 1940s, the city of Vanport was the second largest in Oregon and also housed the state's largest African-American population.
The city was protected by an embankment that kept the Columbia River out of the city. On Memorial Day, 1948, the Columbia swelled 15 feet higher than its normal level. The flood punctured the embankment, spilling water into the city. The flood displaced 18,000 people, many of them African-Americans.
Vanport City Limits
Select to view
"This is the worst disaster ever to hit the state."
Oregon Governor Mark Hatfield
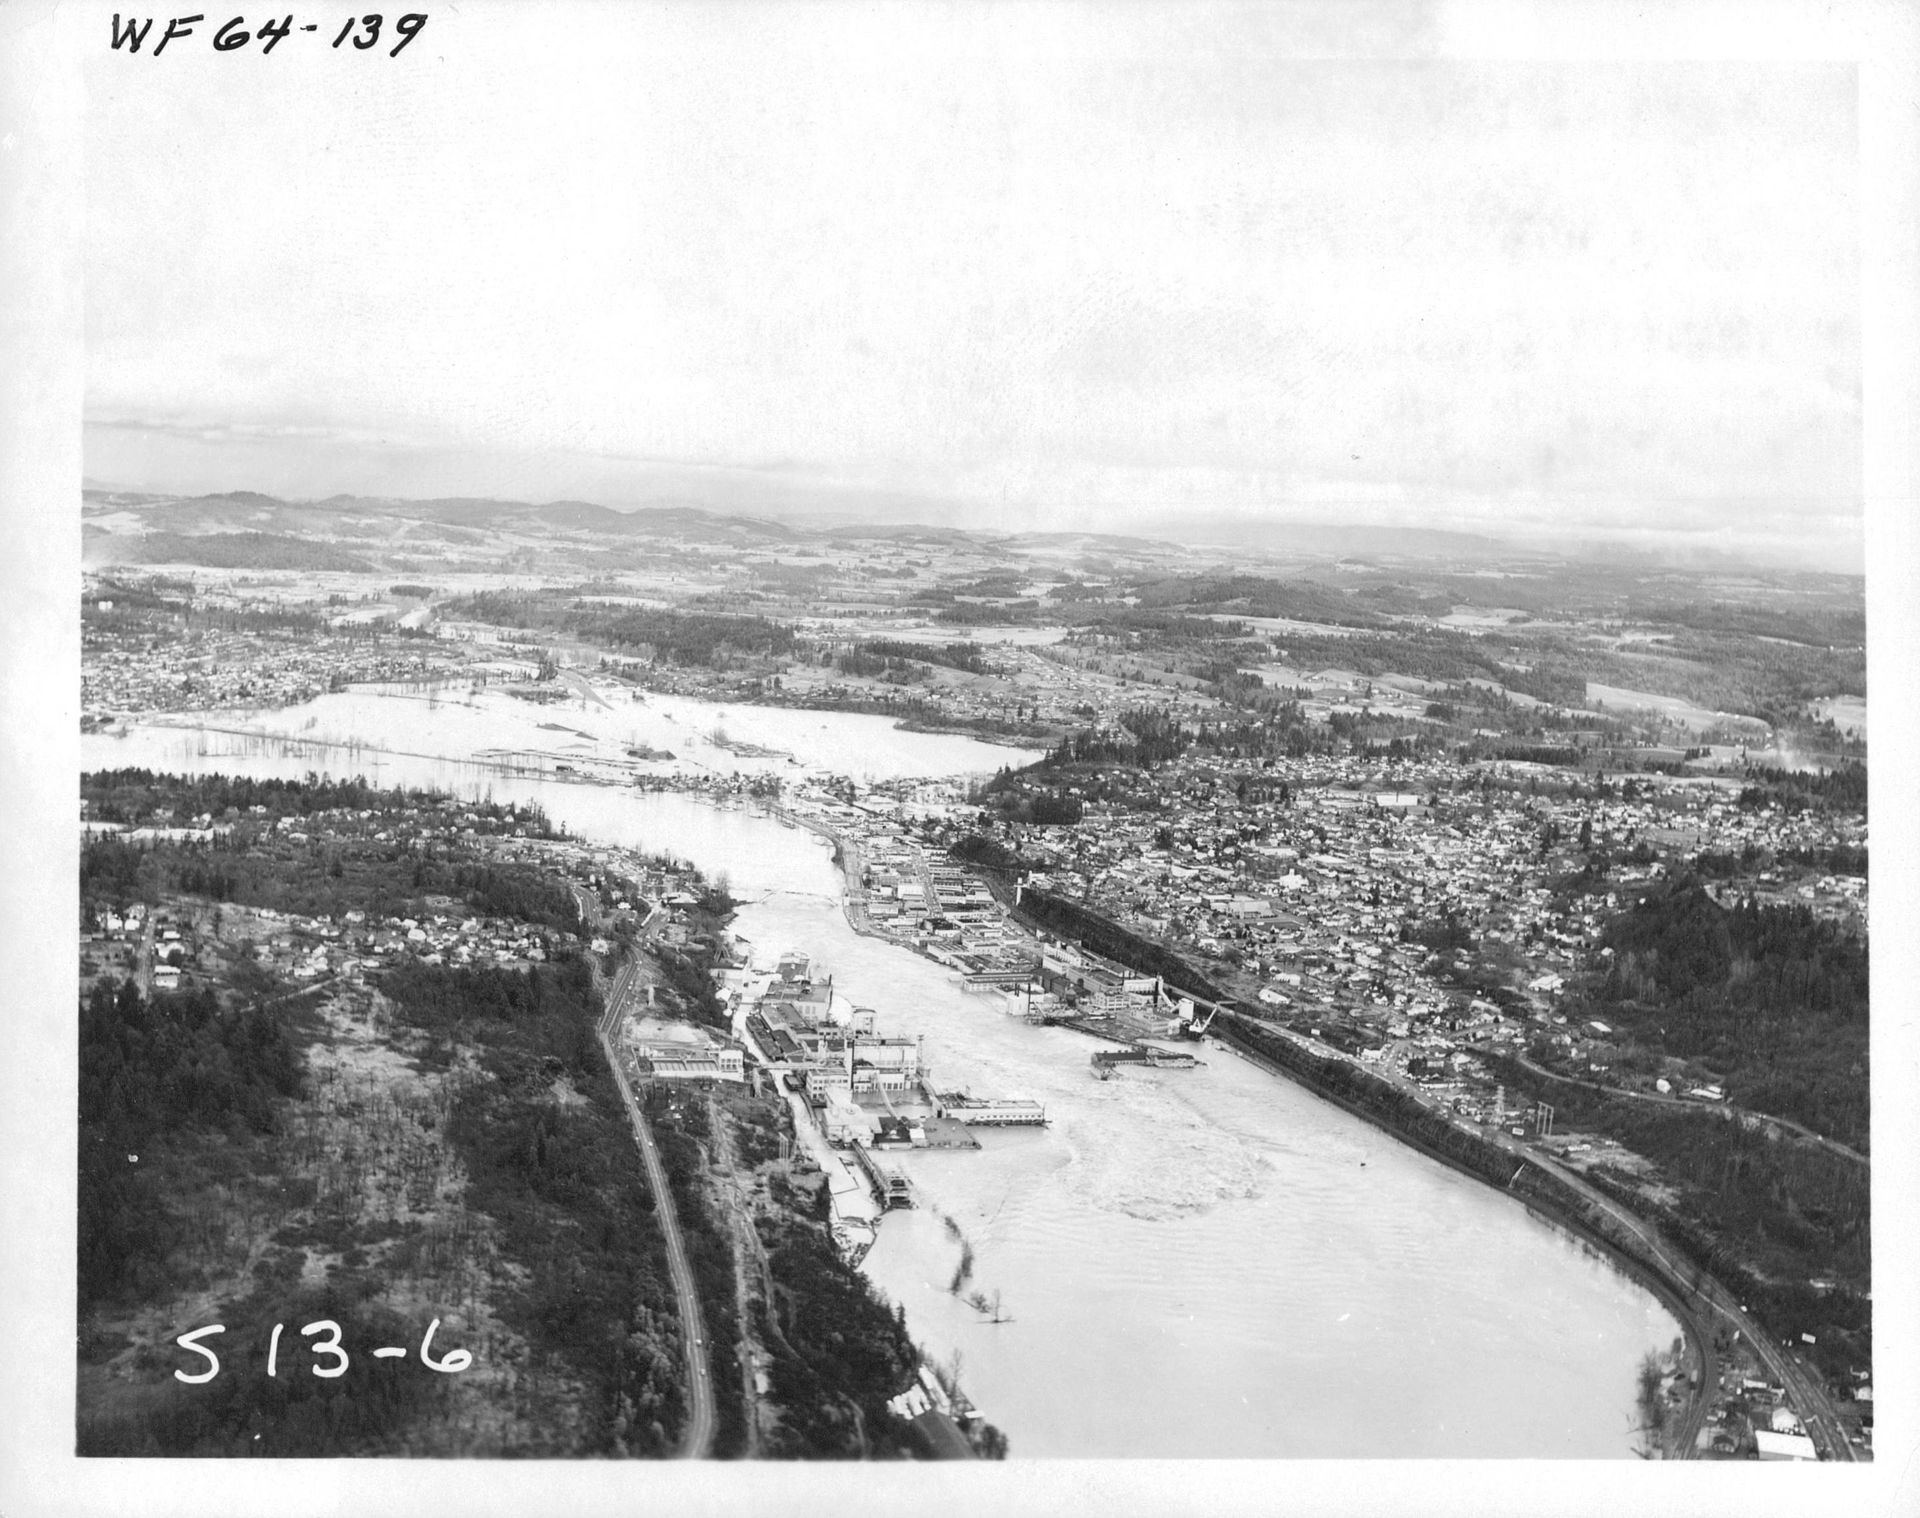
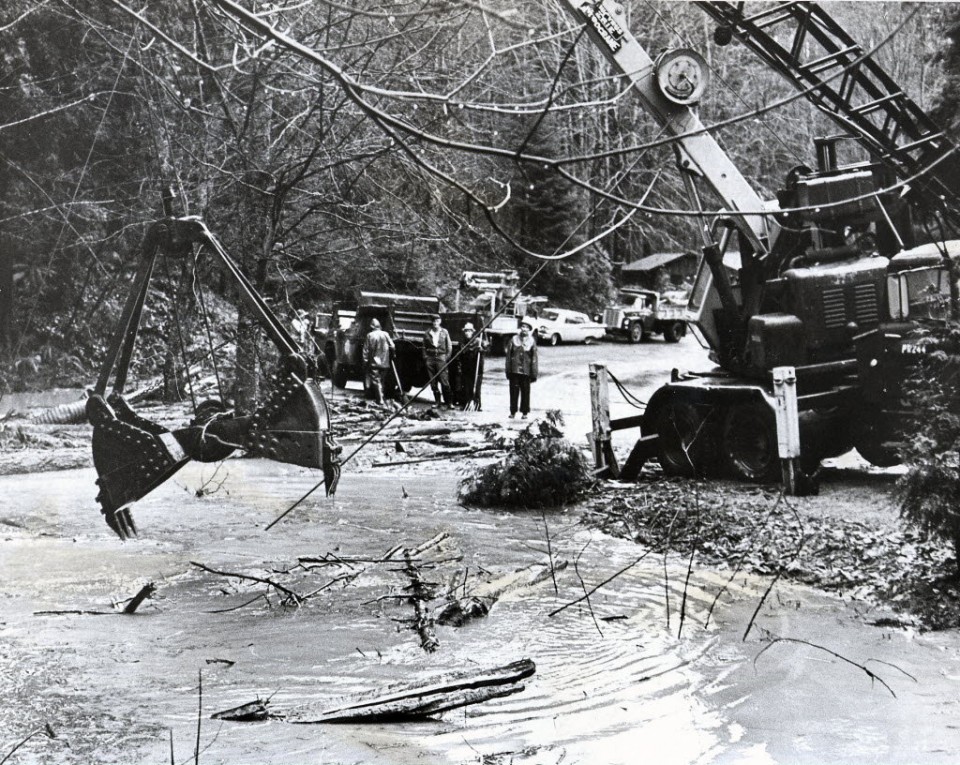
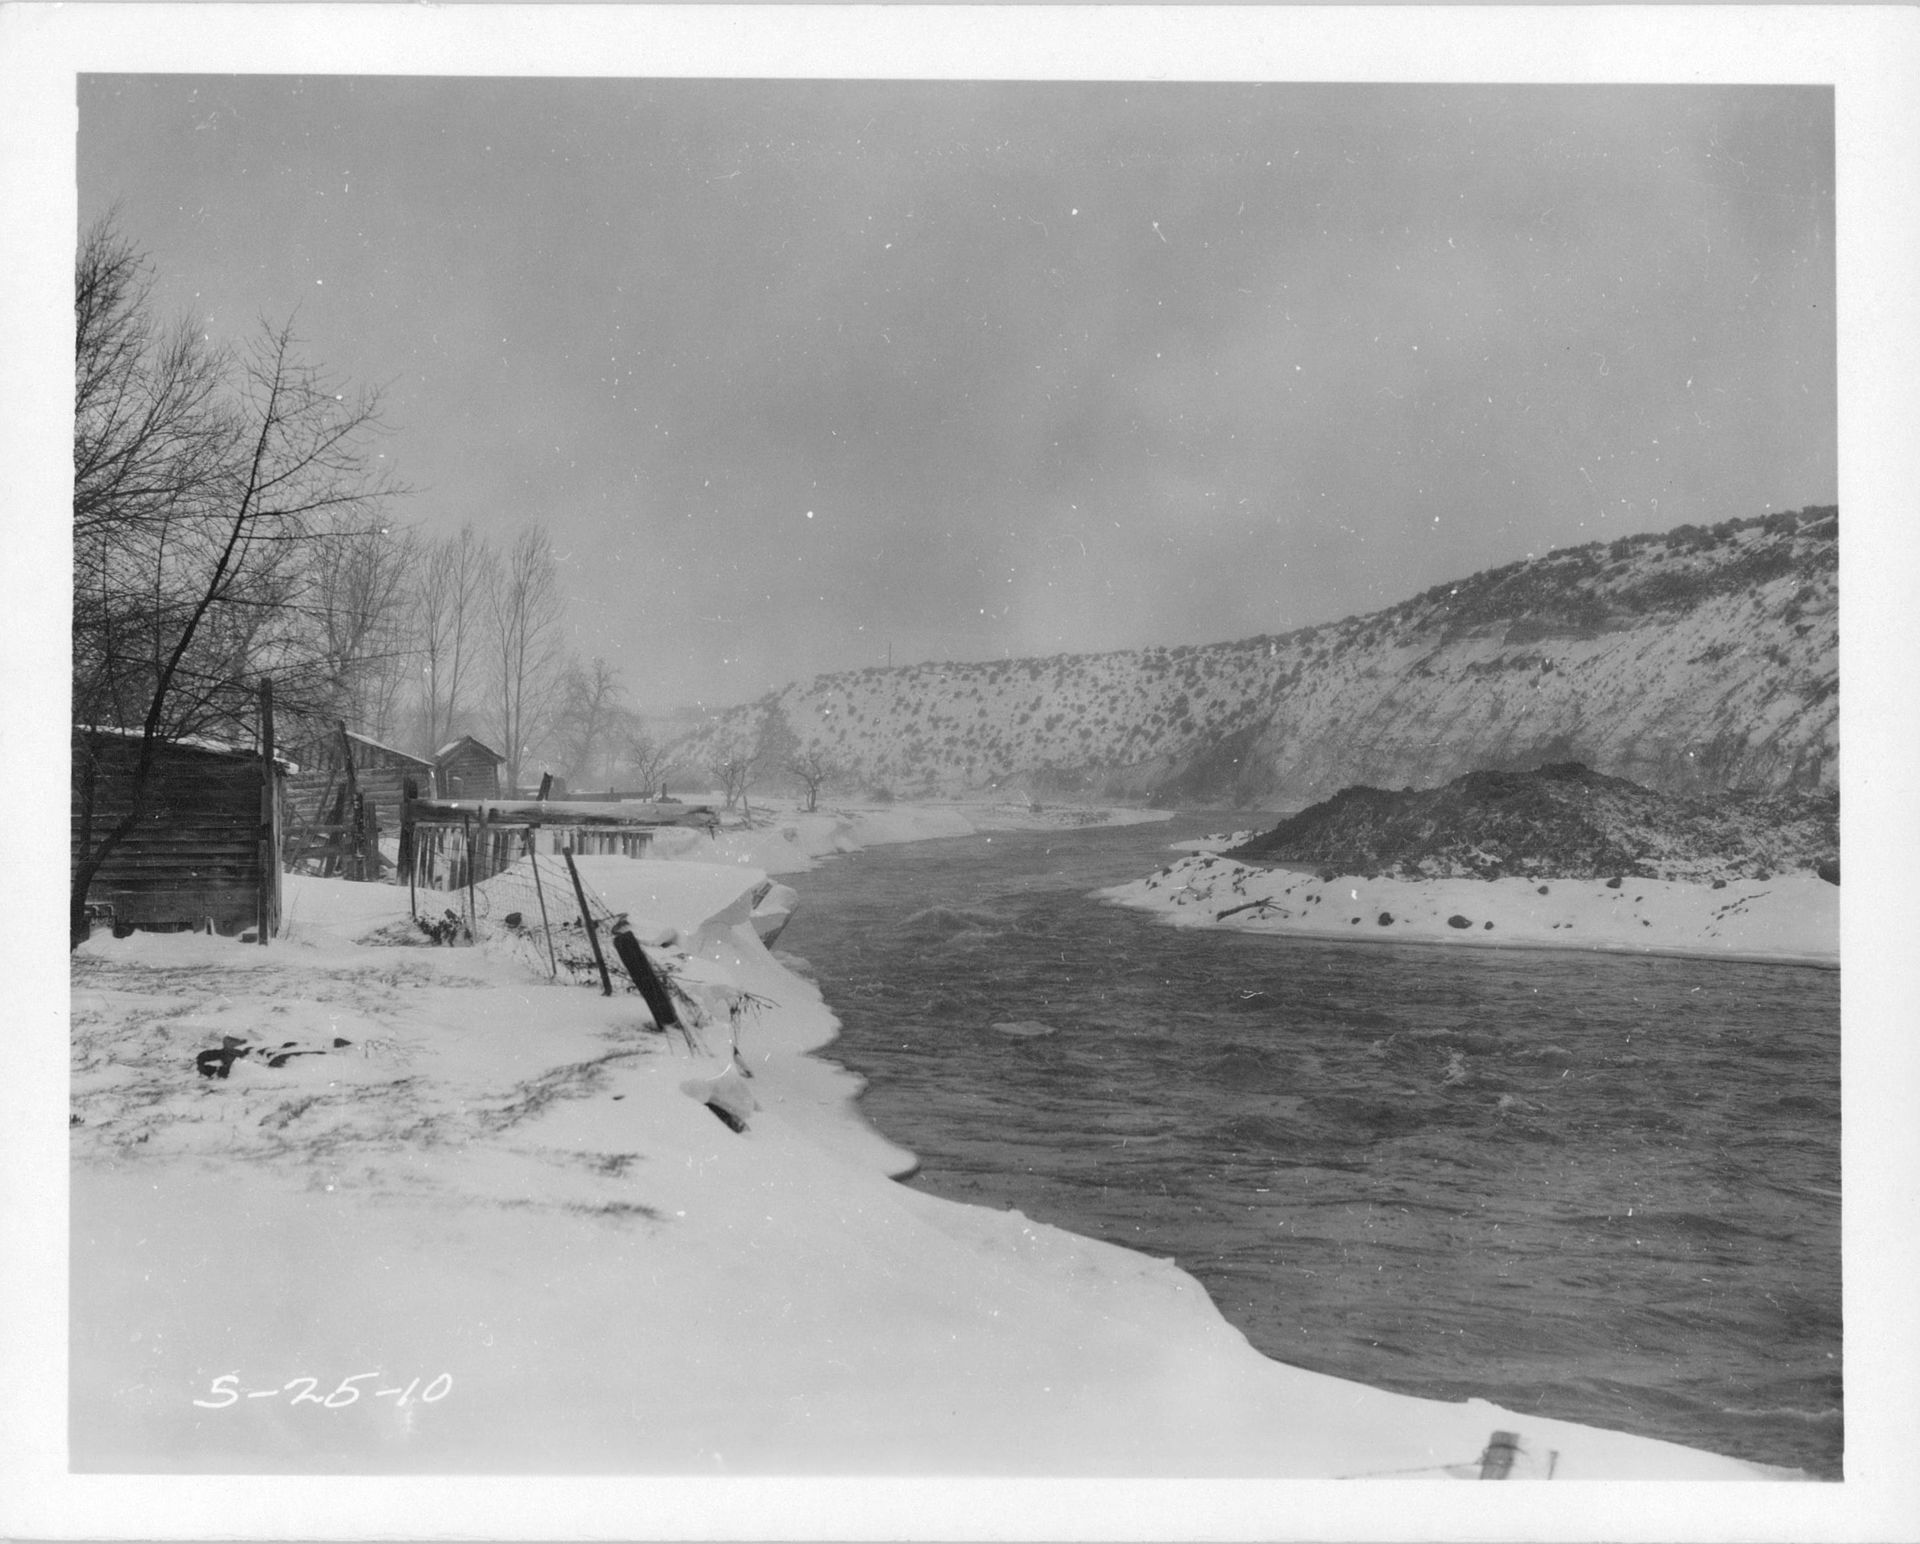
1964 Flood
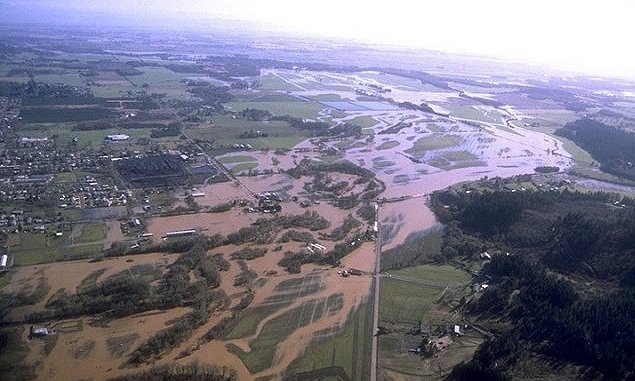
A cold spell that began on December 13th, 1964, brought over 10 inches of snow to most of Oregon, freezing the ground. The snowstorm was followed by a Pineapple Express storm that brought heavy rainfail and raised temperatures. The snow melted, but the ground remained frozen, creating an impermeable surface. While the damages were worst along the Willamette River, flooding also occurred on the Pacific Coast, along the Columbia, and throughout Northern California and Western Idaho.
Flood Extent
Select to view
1996 Flood
January
In 1996, Oregonians were experiencing a wet winter. Saturated soil, bloated creeks, and daily rainfall. It was nothing new.
However, a late January snowstorm and a subsequent Pineapple Express storm created the perfect conditions for Oregon's worst flood disaster since 1964.
1996 Flood
February
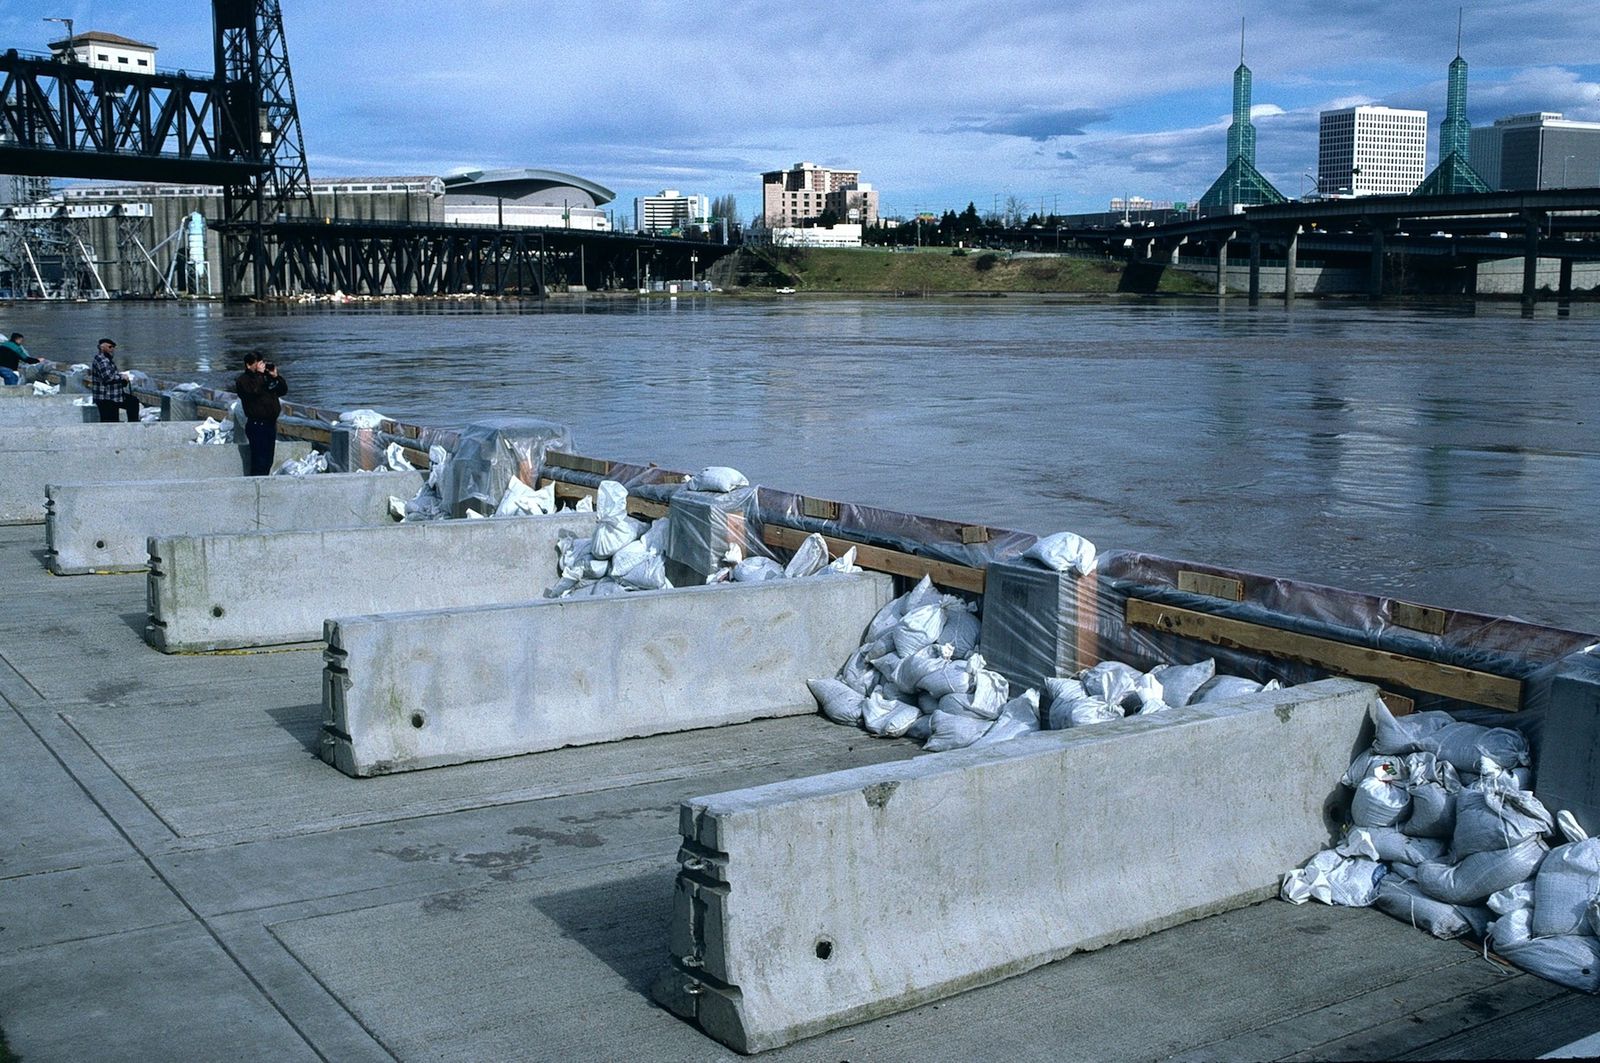
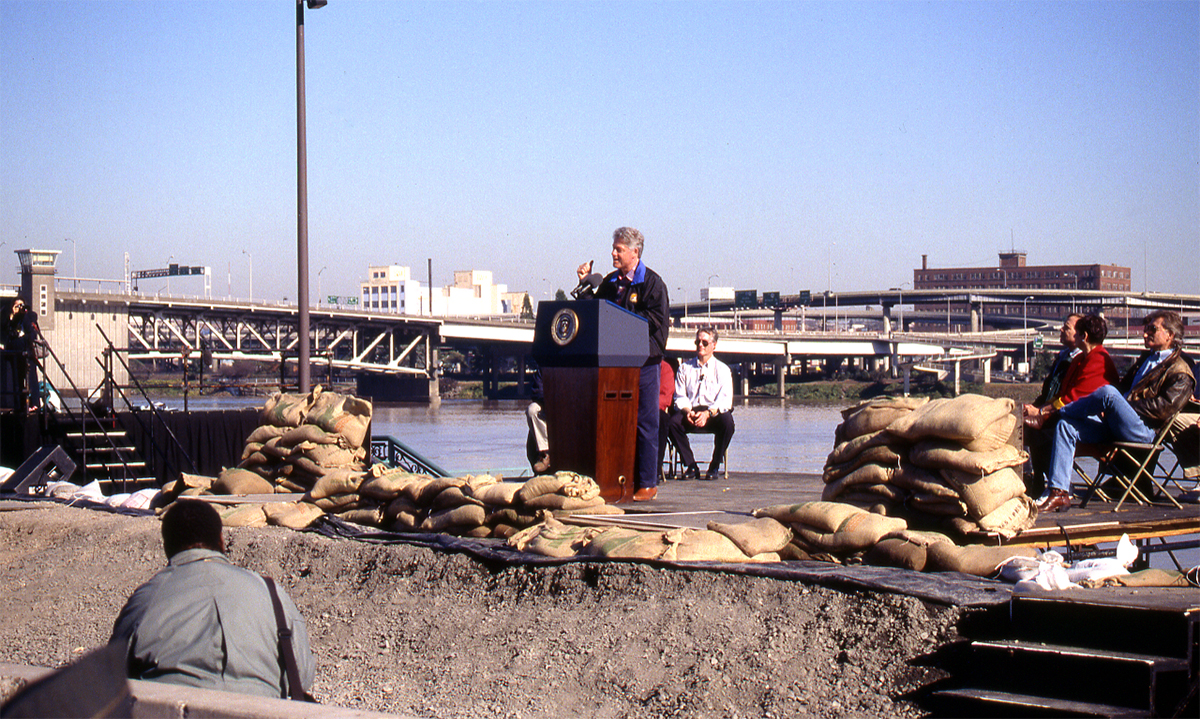
As the waters began to rise, city workers in Portland began constructing what was known as Vera's Wall, named after Portland Mayor Vera Katz. The Willamette River ultimately rose 28 feet in downtown Portland.
However, the Willamette wasn't the only river affected. 26 rivers throughout Oregon experienced flooding and 26 counties were declared federal emergency zones. In total, over 20,000 people were evacuated from their homes.
Select to view
Flood Risk
Over 900,000 Oregonians live in areas designated by FEMA as flood insurance zones. These are areas where there is a greater than 1% annual chance of flooding.
Living in these flood zones requires flood insurance.
Flood Risk Zones